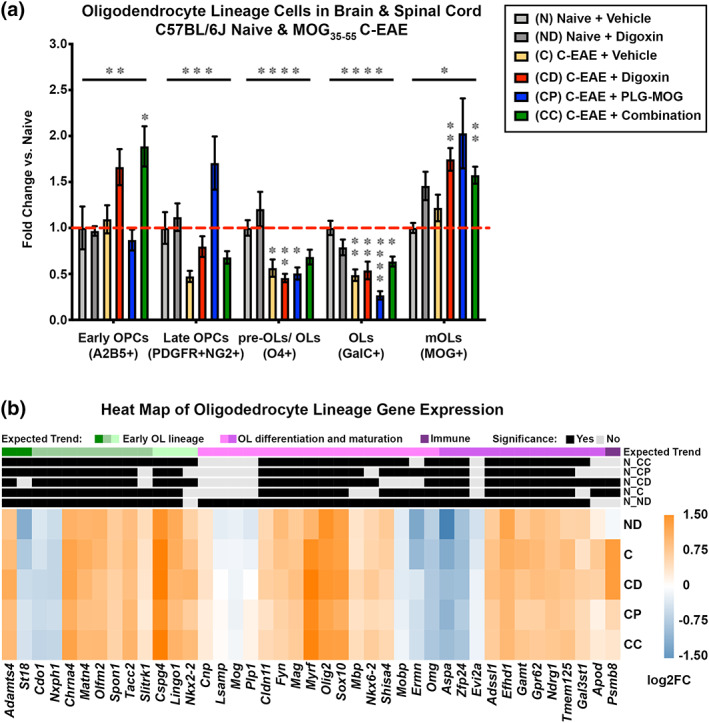
FIGURE 7.

Combined therapeutic treatment with digoxin and MOG35‐55‐specific tolerance was additive for changes throughout the OL lineage in female C57BL/6J C‐EAE. Flow cytometric analysis of the OL lineage in female C57BL/6J forebrain and spinal cord (measured % CNS resident cells in treatment groups as a fold change compared to vehicle control naïve mice) was performed on following groups (n = 3–6 mice/group): Naïve + vehicle (N), Naïve + digoxin (ND), MOG35‐55‐primed + vehicle (C), MOG35‐55‐primed + digoxin (CD), MOG35‐55‐primed + PLG‐MOG (CP), and MOG35‐55‐primed + combination (digoxin + PLG‐MOG) (CC) treated mice (a). The heatmap shows relative expression of genes as fold change (log2) based on expected trend at 1 month of treatment as compared to Naïve + vehicle. Orange color indicates relative upregulation, whereas blue indicated relative down regulation. Row annotations mark different expected trends, including; early OL lineage genes (green), OL differentiation and maturation genes (purple) as well as immune (dark purple). Genes that were significantly differentially expressed are marked in black (b). (*p < .05, **p < .01, ***p < .001, ****p < .0001).
