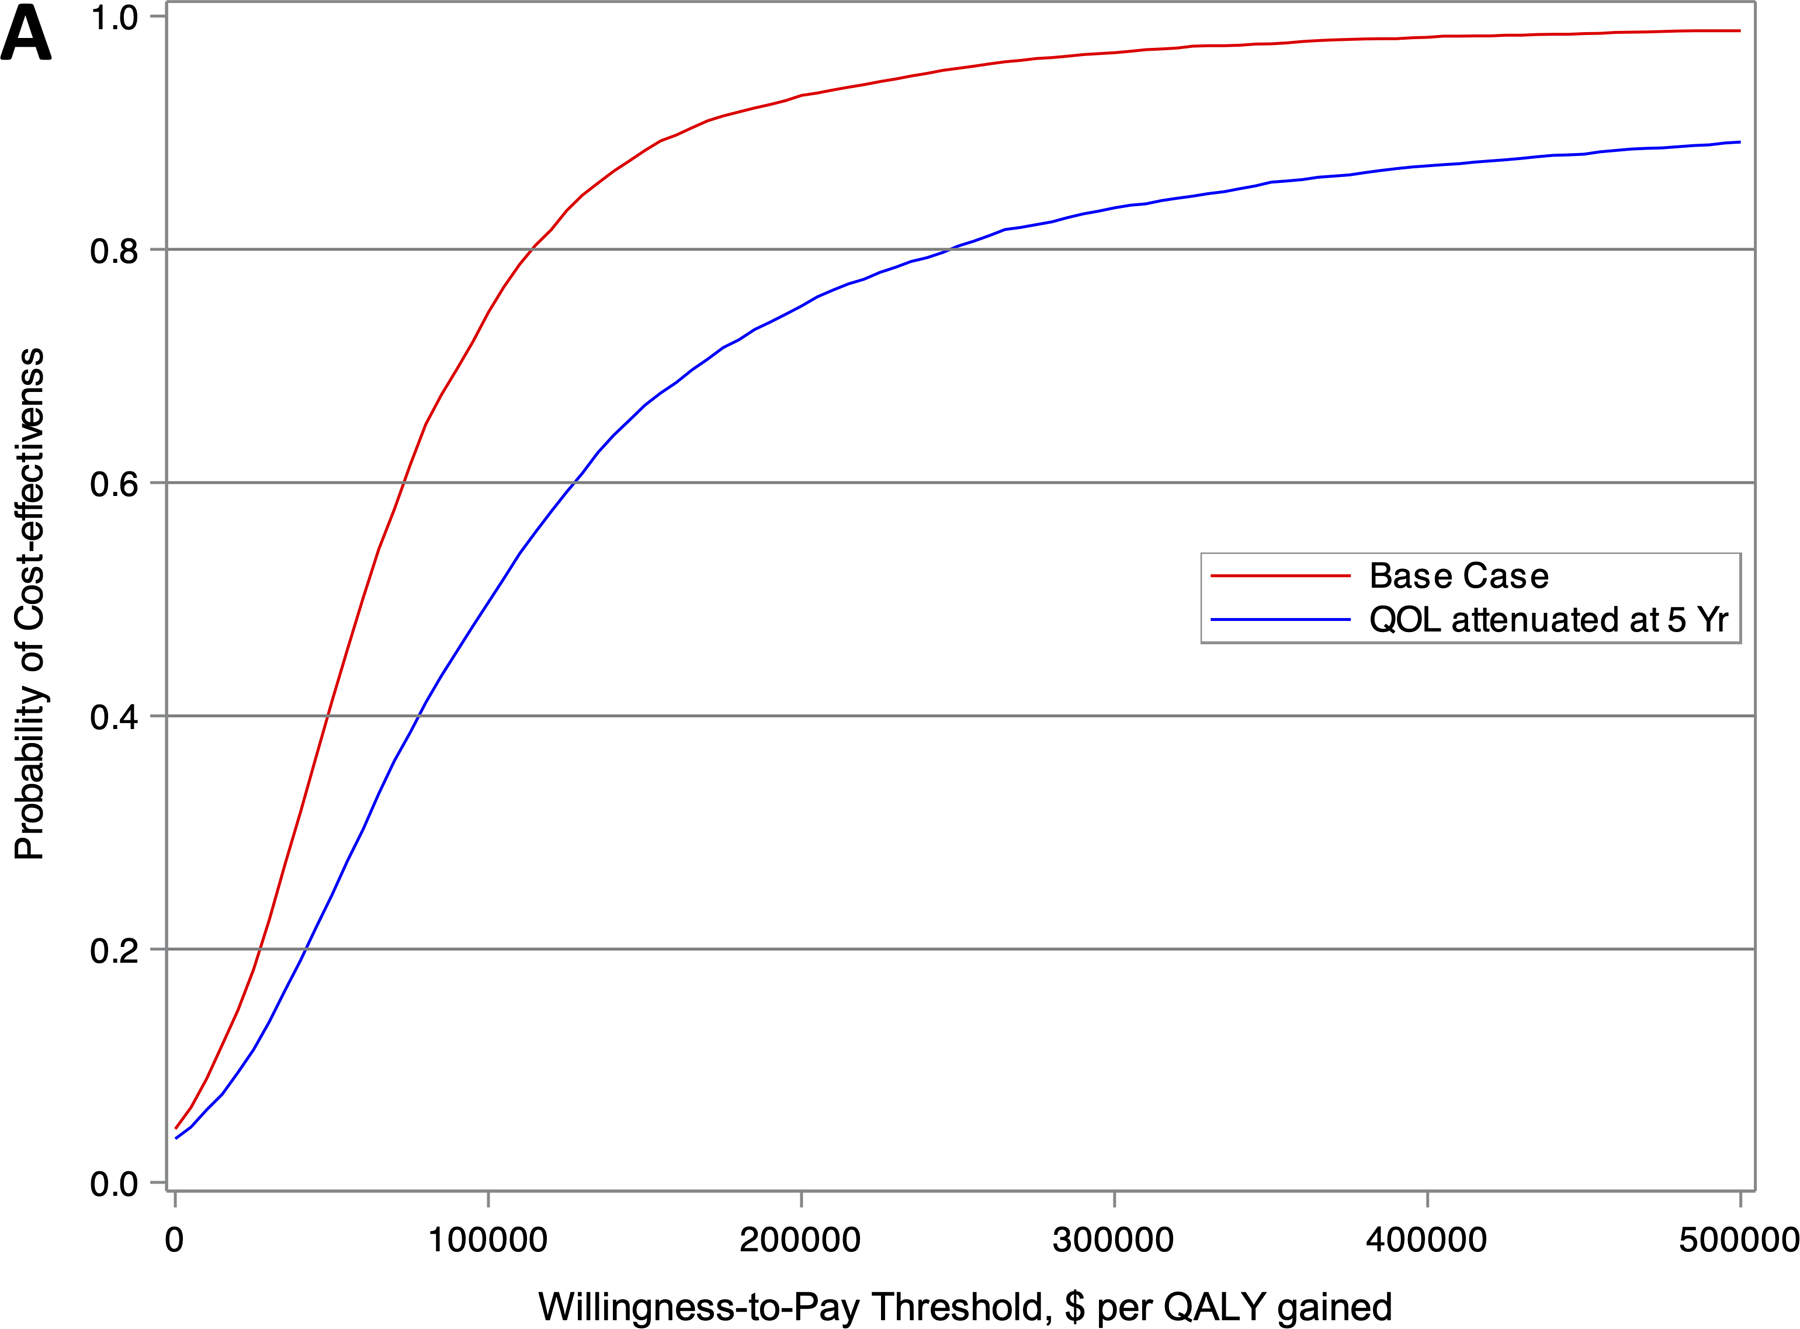
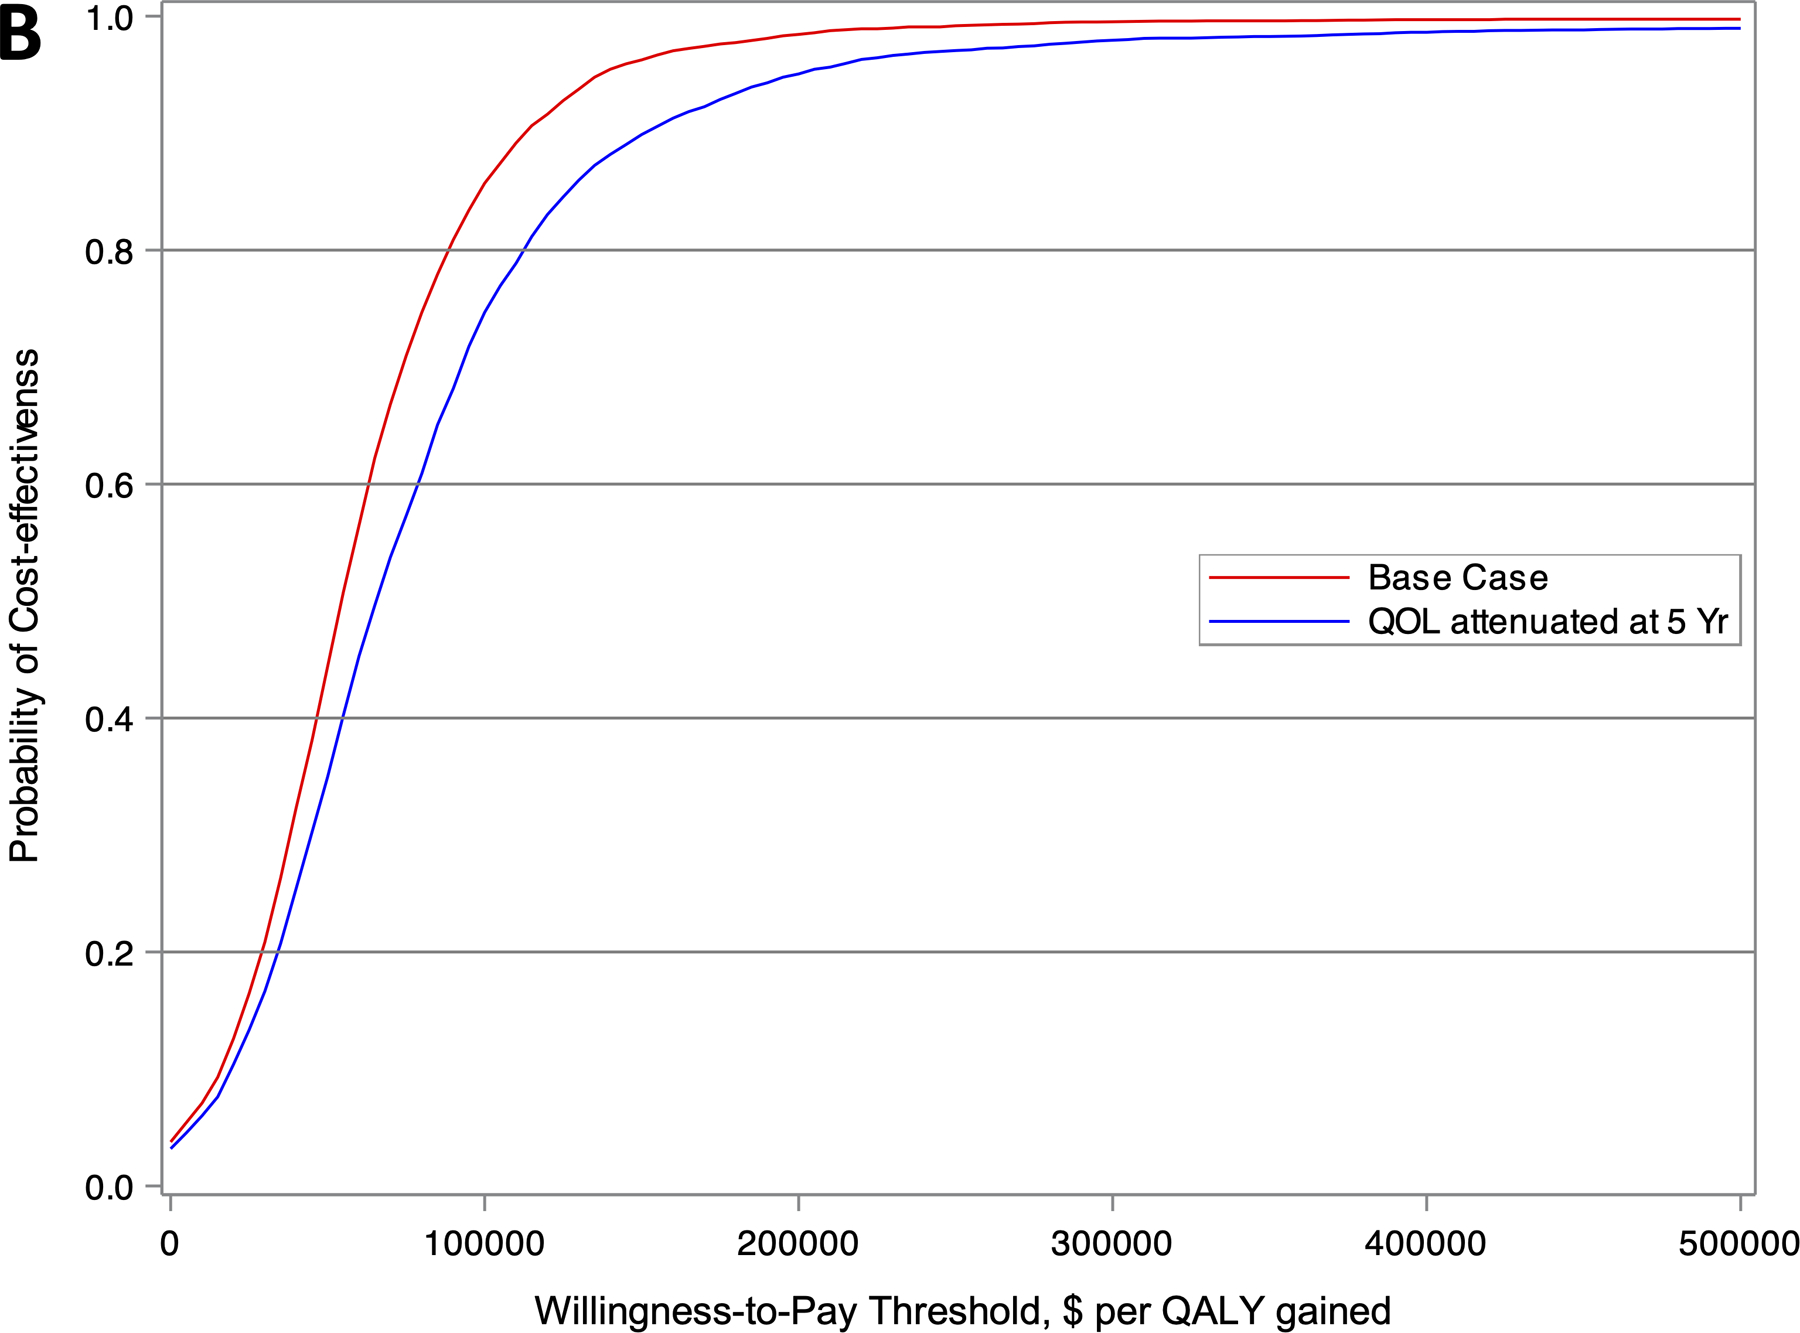
Figure 2.


Cost-effectiveness acceptability curve showing the probability of a strategy being cost-effective over a range of willingness-to-pay (WTP) thresholds for (A) the entire CABANA cohort (N=2204), and (B) the heart failure subgroup with NYHA class ≥II symptoms (N=778). The red and blue lines represent the base case and sensitivity analysis with attenuation in quality of life after 5 years, respectively.
