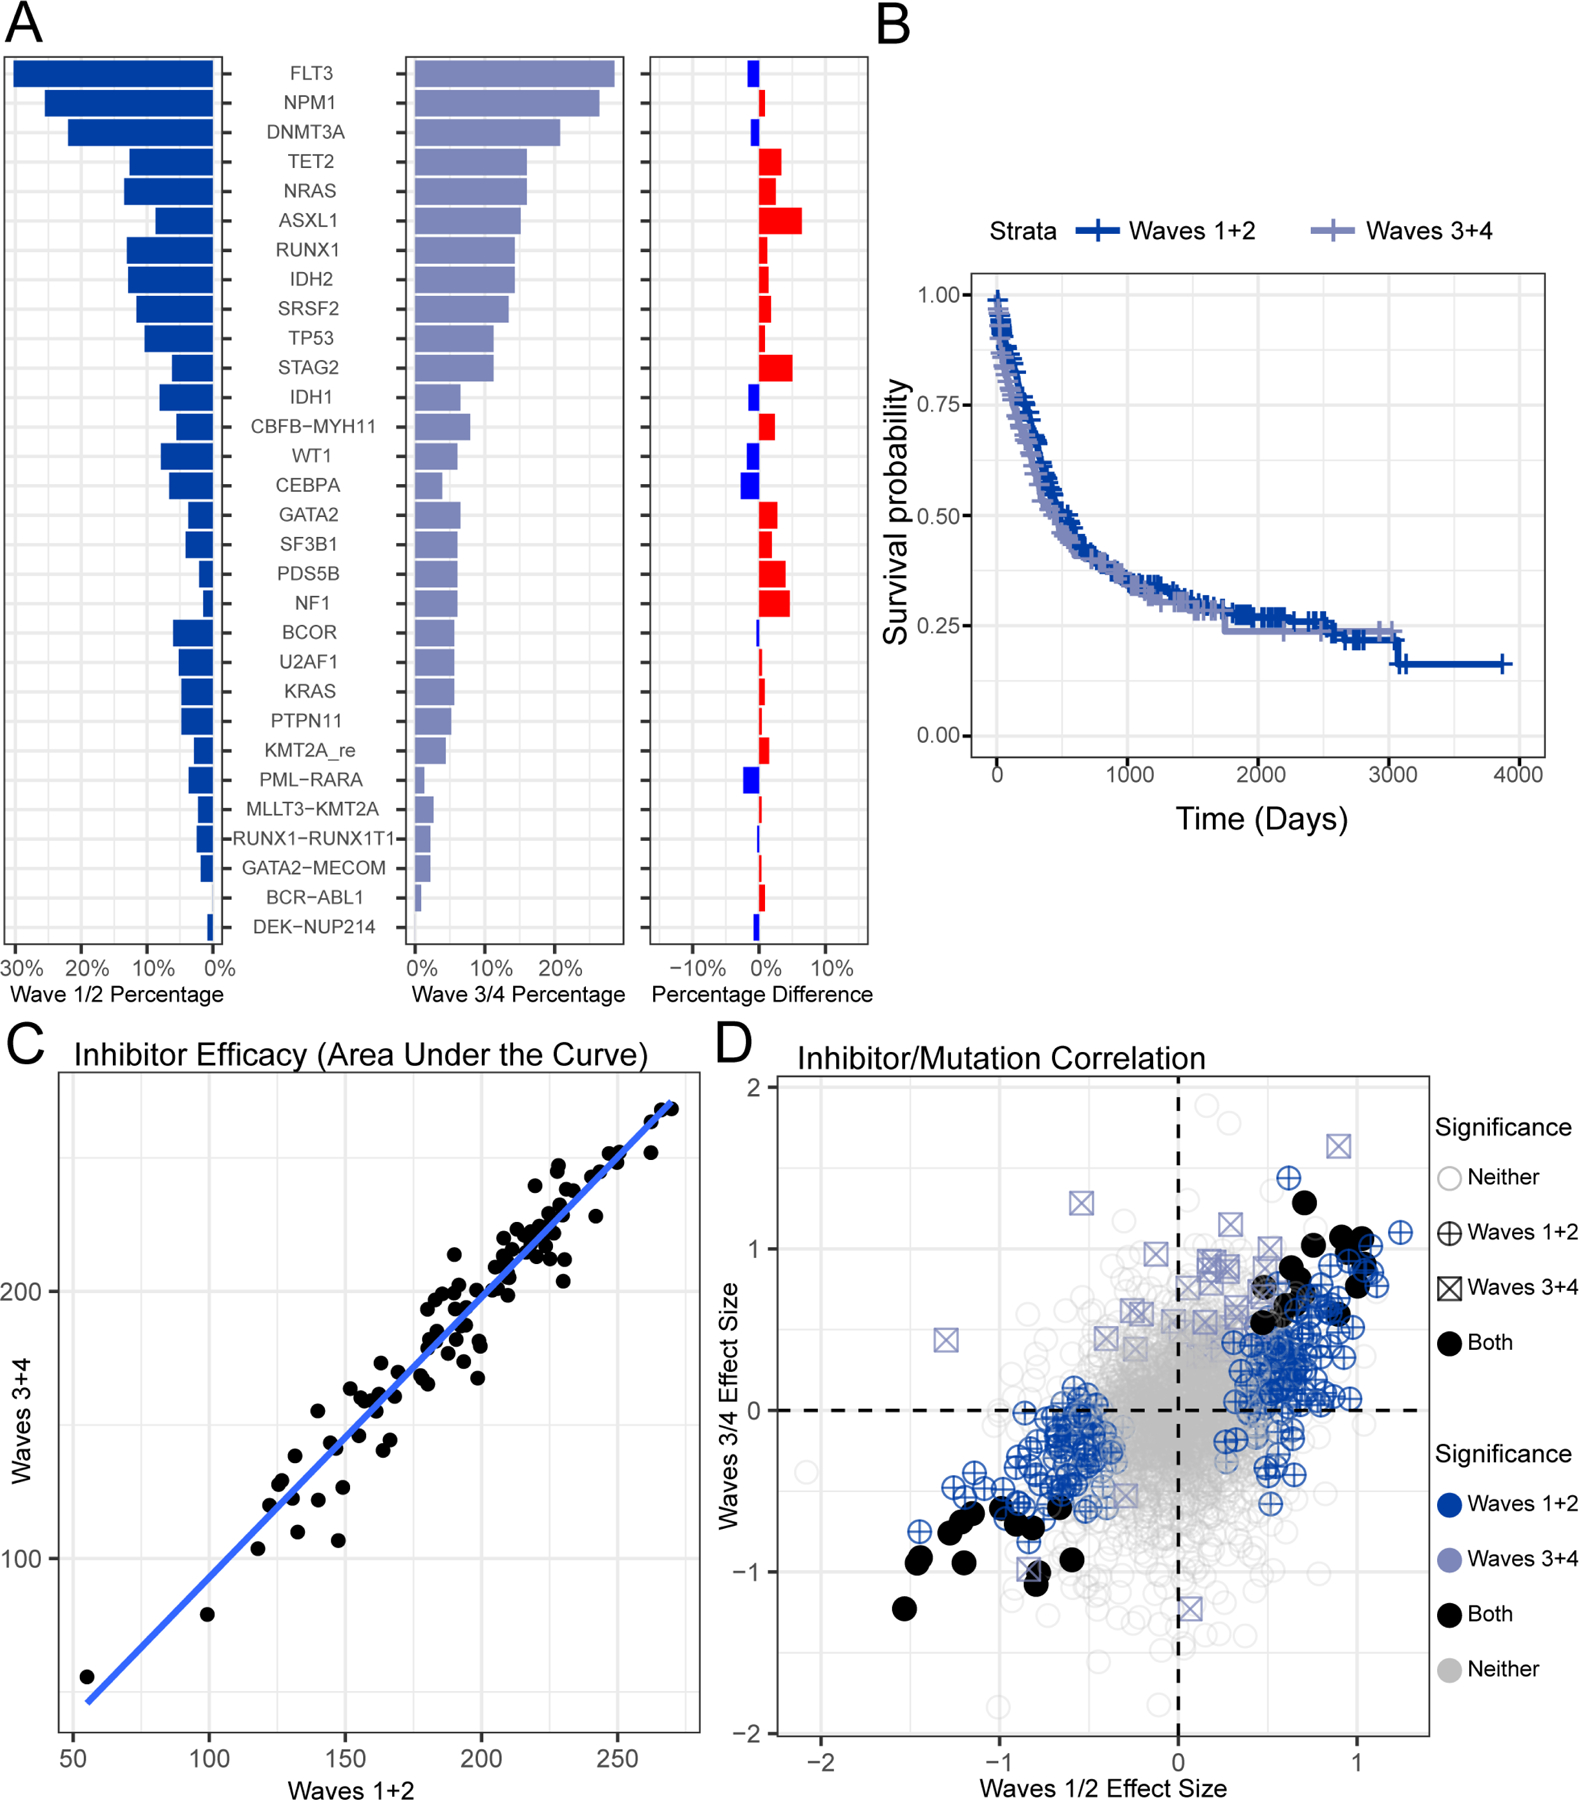
Figure 1. Genomic features and outcomes for the Beat AML cohorts are concordant.

(A) The percentage of patients with a somatic mutation or gene fusion is shown for Waves 1+2 and Waves 3+4 cohorts and percentage difference is shown (average difference is 1.037%). (B) Overall survival is shown for Waves 1+2 and Waves 3+4 cohorts (p-value 0.2 log-rank test). (C). Ex vivo drug response values are shown comparing the average AUC for each drug (points) within de novo AML patients comparing Waves 1+2 to Waves 3+4 (Pearson’s correlation r=0.965). (D) Waves 3+4 can serve as validation cohort to assess prior mutation-inhibitor associations (Tyner et al., 2018). The difference in average response of specimens that are mutated versus wild type for a given gene (effect size) are plotted for Waves 1+2 on the x-axis and Waves 3+4 on the y-axis. Effect sizes were expressed as Glass’s delta with respect to the wild type group. Significance was based on the Welch’s t-test comparing mutated vs wild type and requiring a minimum of five mutations in Waves 1+2 and three mutations in Waves 3+4. Adjusted significance in Waves 1+2, Waves 3+4, or both are also annotated (qvalue < 0.05; (Storey and Tibshirani, 2003)).
