
Figure 2. Differentiation scoring to characterize expression and mutational patterns.
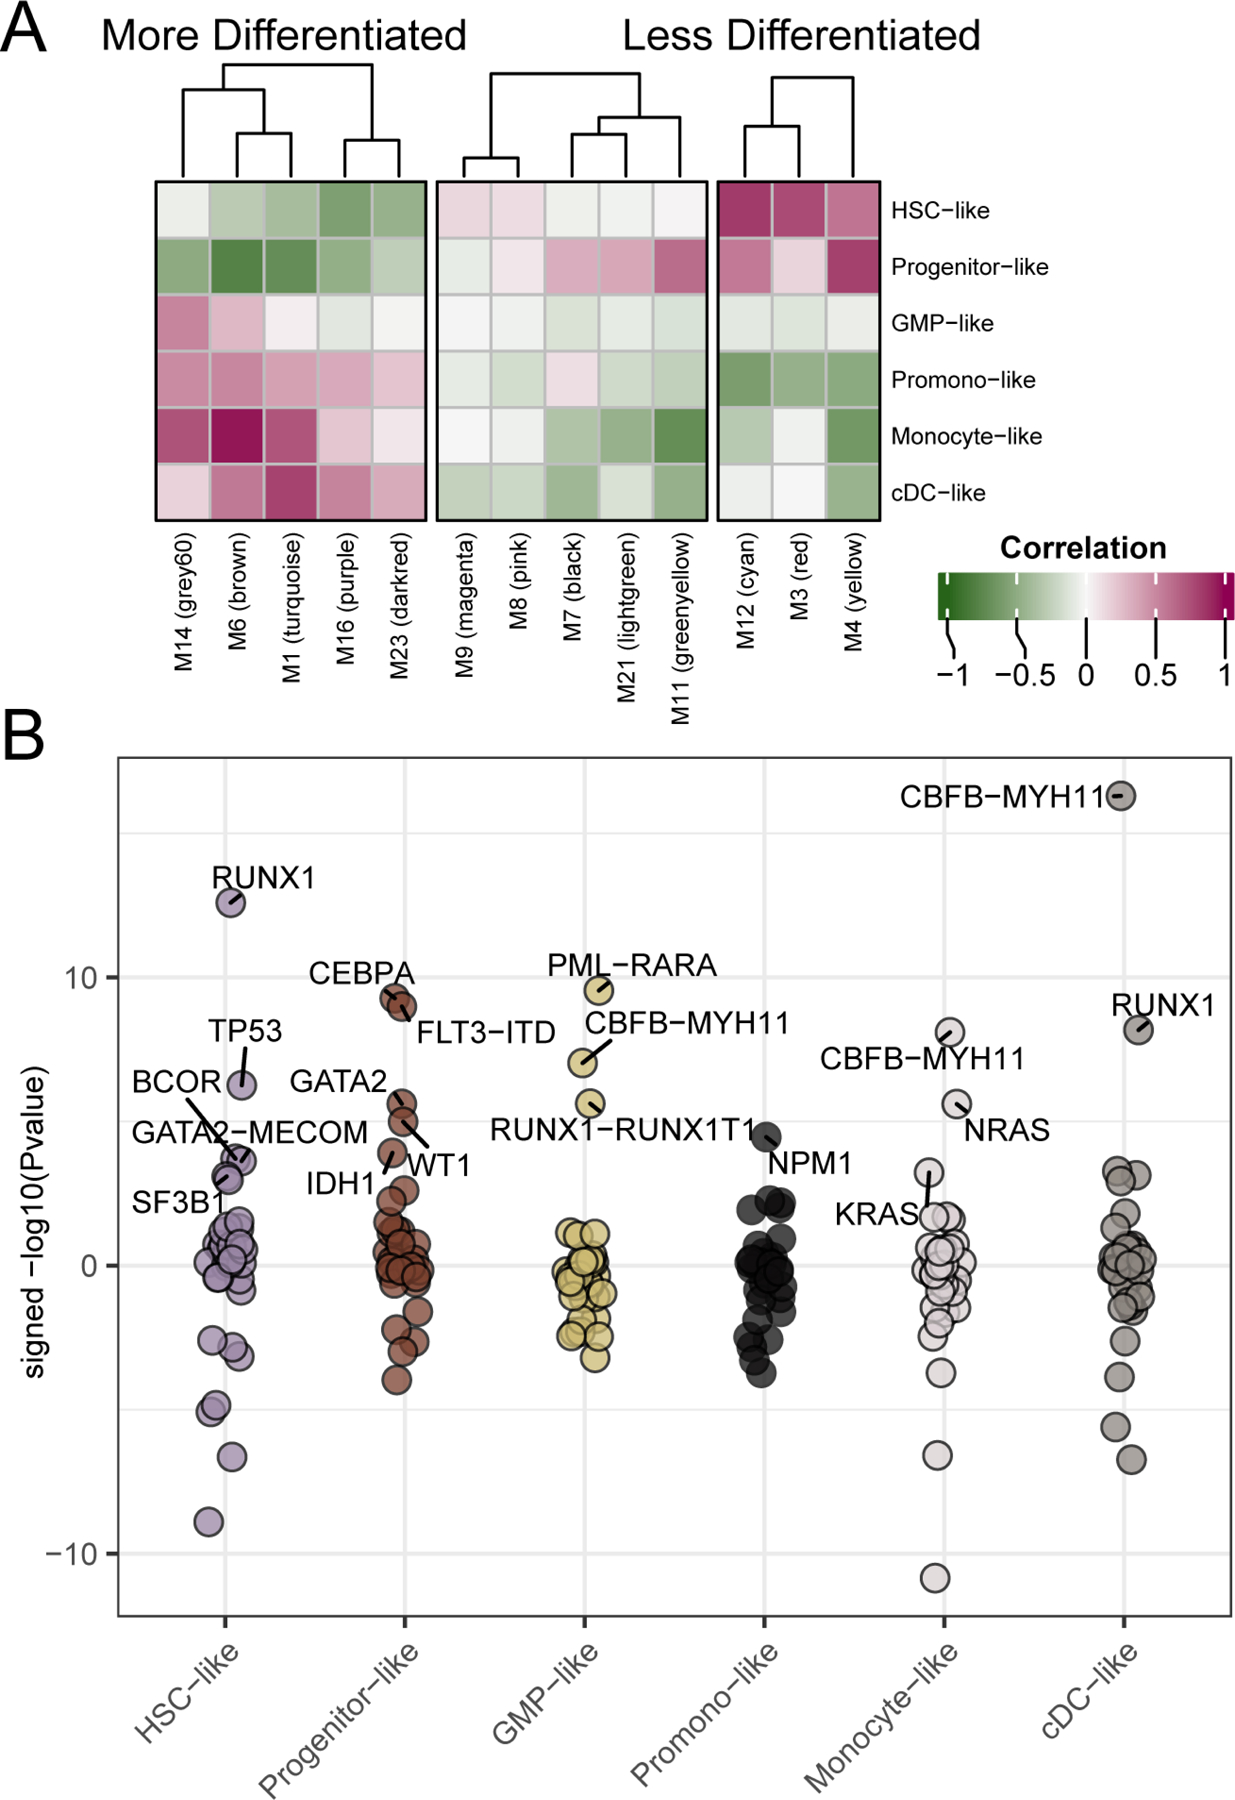
We generated malignant cell-type gene expression scores for each of our patients relative to 6 sets of 30 genes derived from expression signatures from single-cell sequencing (Van Galen et al., 2019). (A) By examining the correlation of expression module eigengenes and the cell-type scores we can see that WGCNA expression modules (X-axis) show correlation with differentiation cell-type scores (y-axis). Pearson’s correlation r-values are annotated. (B) Similarly, we can determine the mutational events significantly associated with each of the cell-type scores. Shown are the signed –log10(Welch’s t-test p-values) for the differences in cell-type score with respect to mutational status. Up to the top 5 most significant (qvalue < 0.05; (Storey and Tibshirani, 2003)) mutational events associated with enrichment of each cell-type score are highlighted. Full data are available in Table S2.