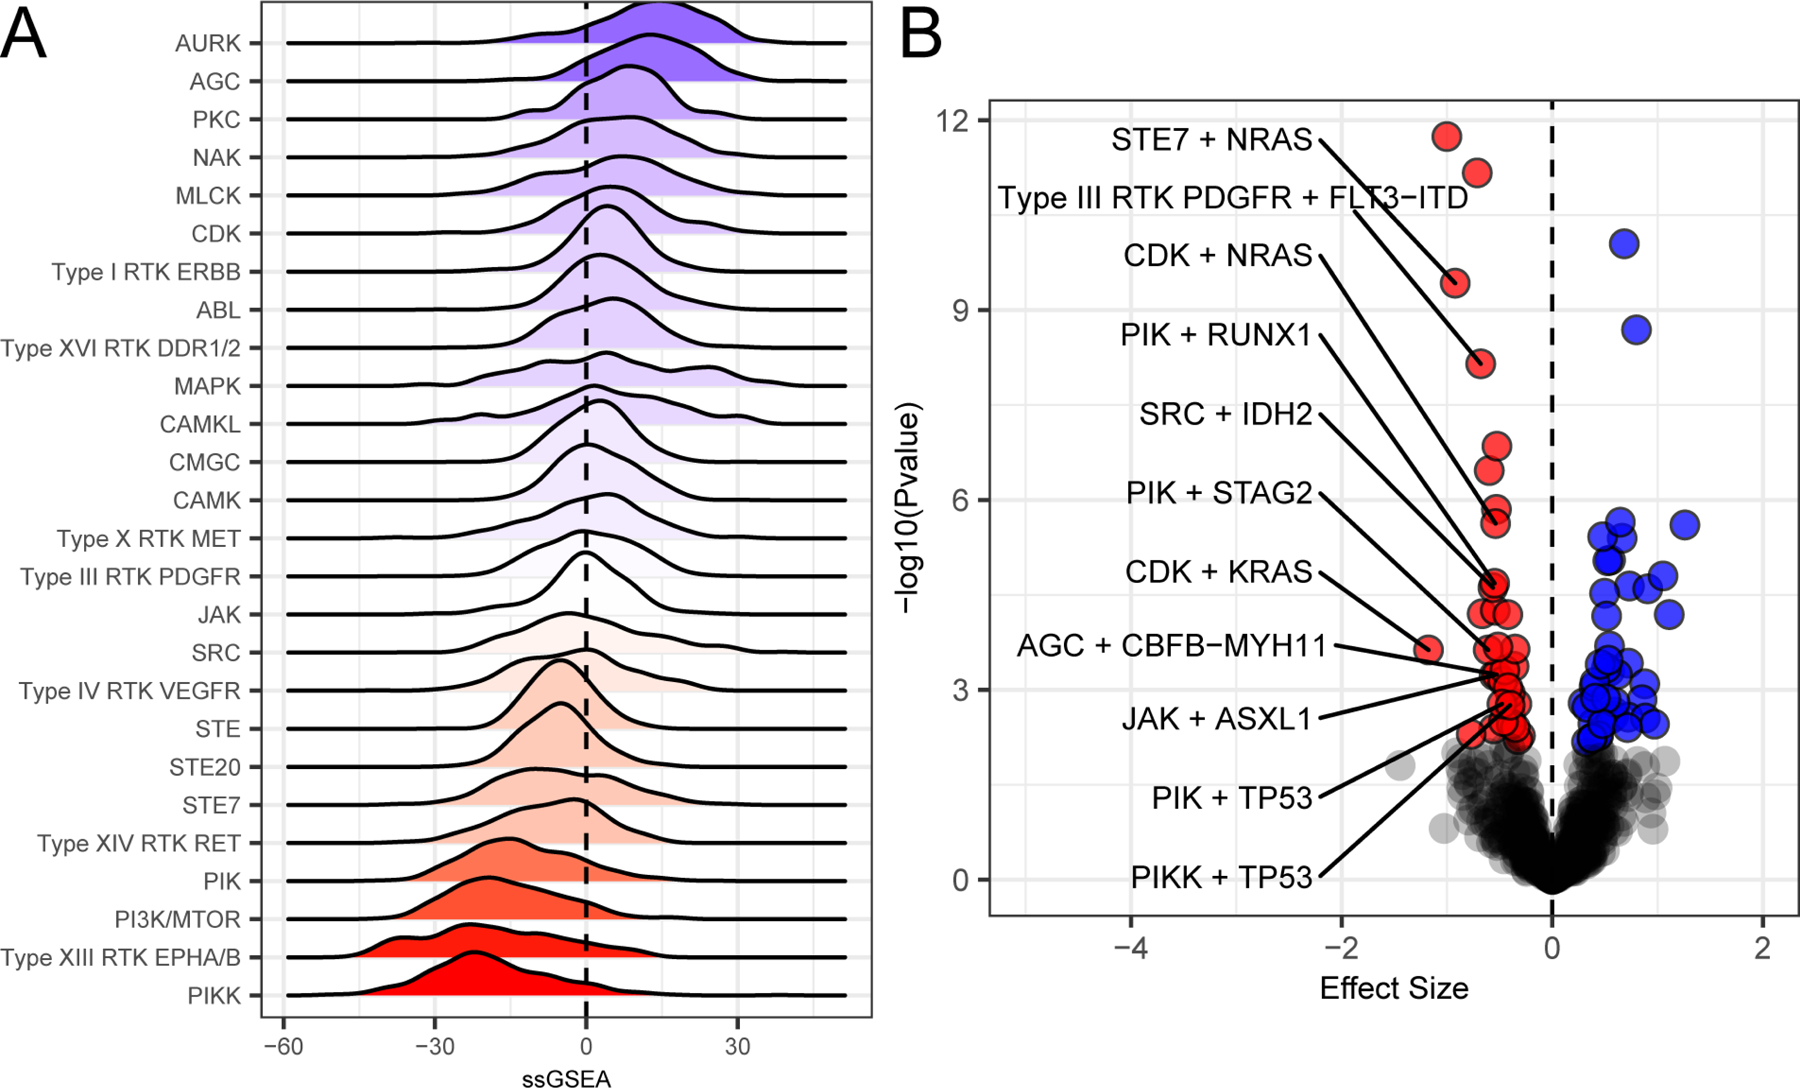
Figure 4. Genomic associations of drug family response.

As in Figure 3A, we define sensitivity by red and resistant with blue and with white indicating intermediate. (A) Drug target information, where available, was annotated for all drugs on the panel, and these targets were mapped onto pathways to create drug families that share common targets and pathways. Full mapping of drug families is available in Table S4. Family-level drug response summaries allow us to identify cohort-level responses. Some like the Aurora Kinase family (Aurk) show overall resistance and others like Type XIII RTKs (Eph) or PIKK are overall sensitive. (B). We examined correlations between mutational status and drug family response. Mutational status associates with drug family response either in terms of significant (qvalue < 0.05; (Storey and Tibshirani, 2003)) sensitivity (red) or resistance (blue). Association tests were performed using Welch’s T-test comparing mutated vs wild type and requiring at least 5 mutations for a given mutational event. Effect size was based off of Glass’s delta using wild type as the reference. Full data are available in Table S5.
