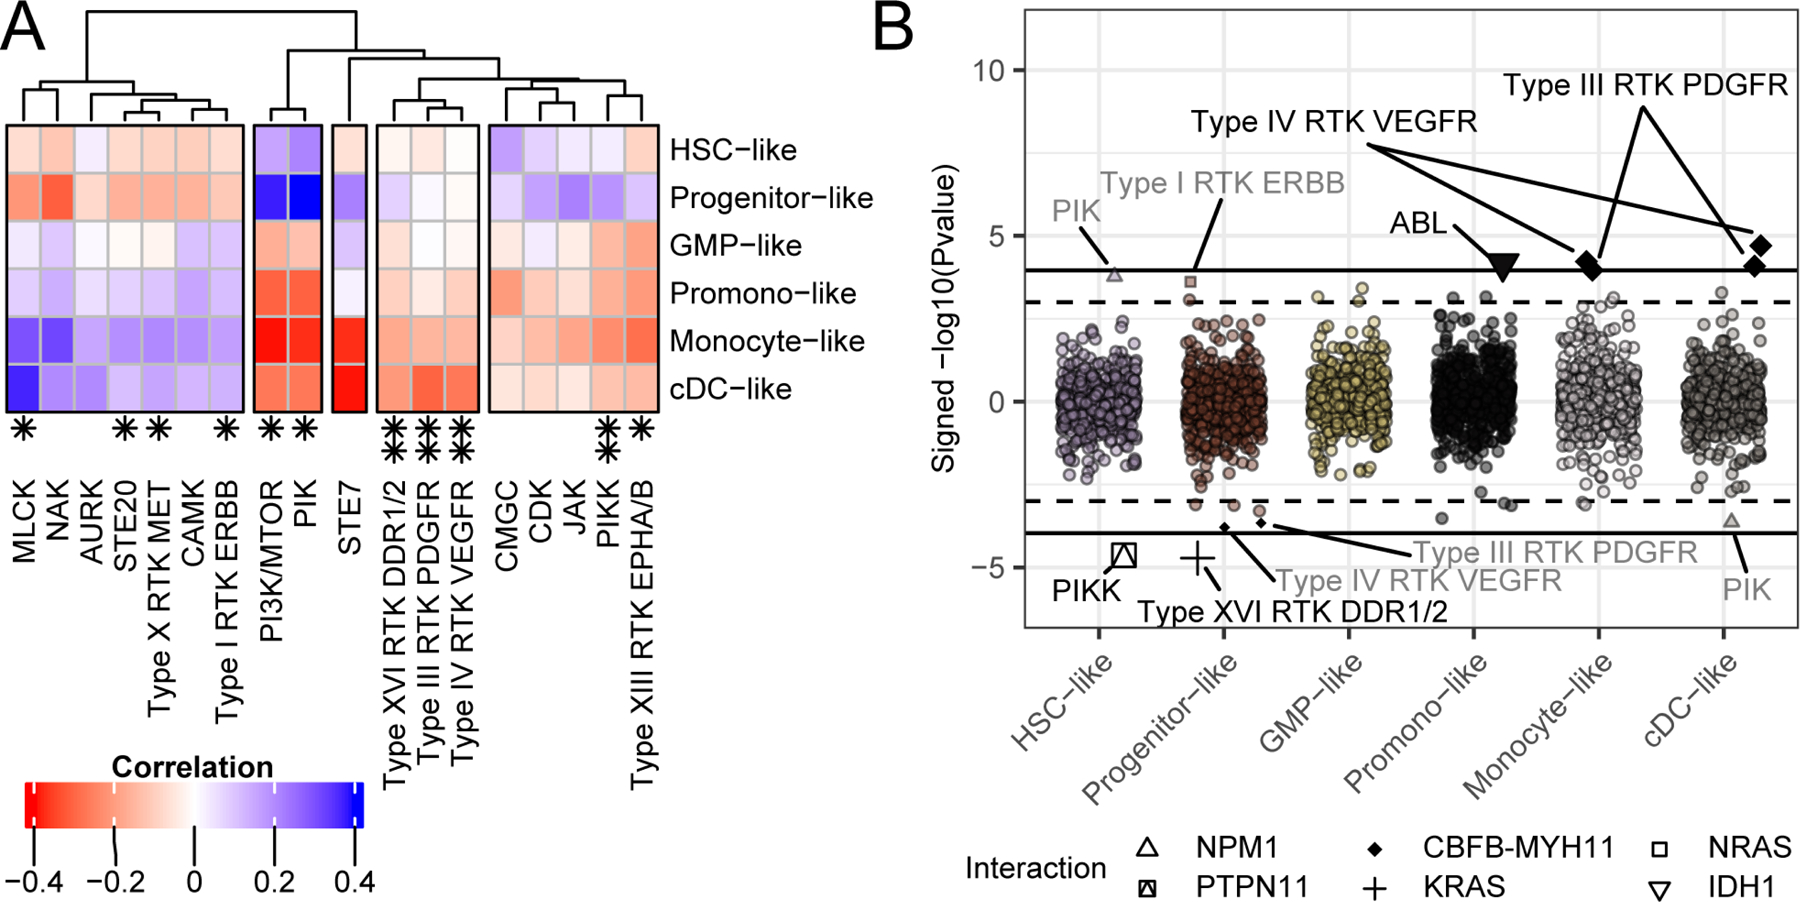
Figure 5. Drug family response is influenced by and conditional on cell-type.

(A) Similar to the analysis of single-inhibitor responses and their correlation with cell-type score, shown in Figure 3A, we can group the drug families from Figure 4 by their association with cell-type differentiation scores based on their Pearson’s correlation (BY FDR < 0.05; (Benjamini and Yekutieli, 2001)). (B) We can also determine instances where drug family correlation with mutational state is conditional on cell-type (as we did for individual drugs in Figure 3B). The mutations that play a significant drug response modification role based on the statistical interaction between cell-type score and mutation, requiring at least 10 mutations per event is shown. The Y-axis indicates the signed -log10 (Pvalue), the X-axis indicates cell-type. The interactions are listed by text (qvalue < 0.1 and qvalue < 0.05; (Storey and Tibshirani, 2003)) and distinguished by a dashed and solid line respectively. Full data are available in Table S6.
