
Figure 1. Anatomic and functional screen for auditory neurons.
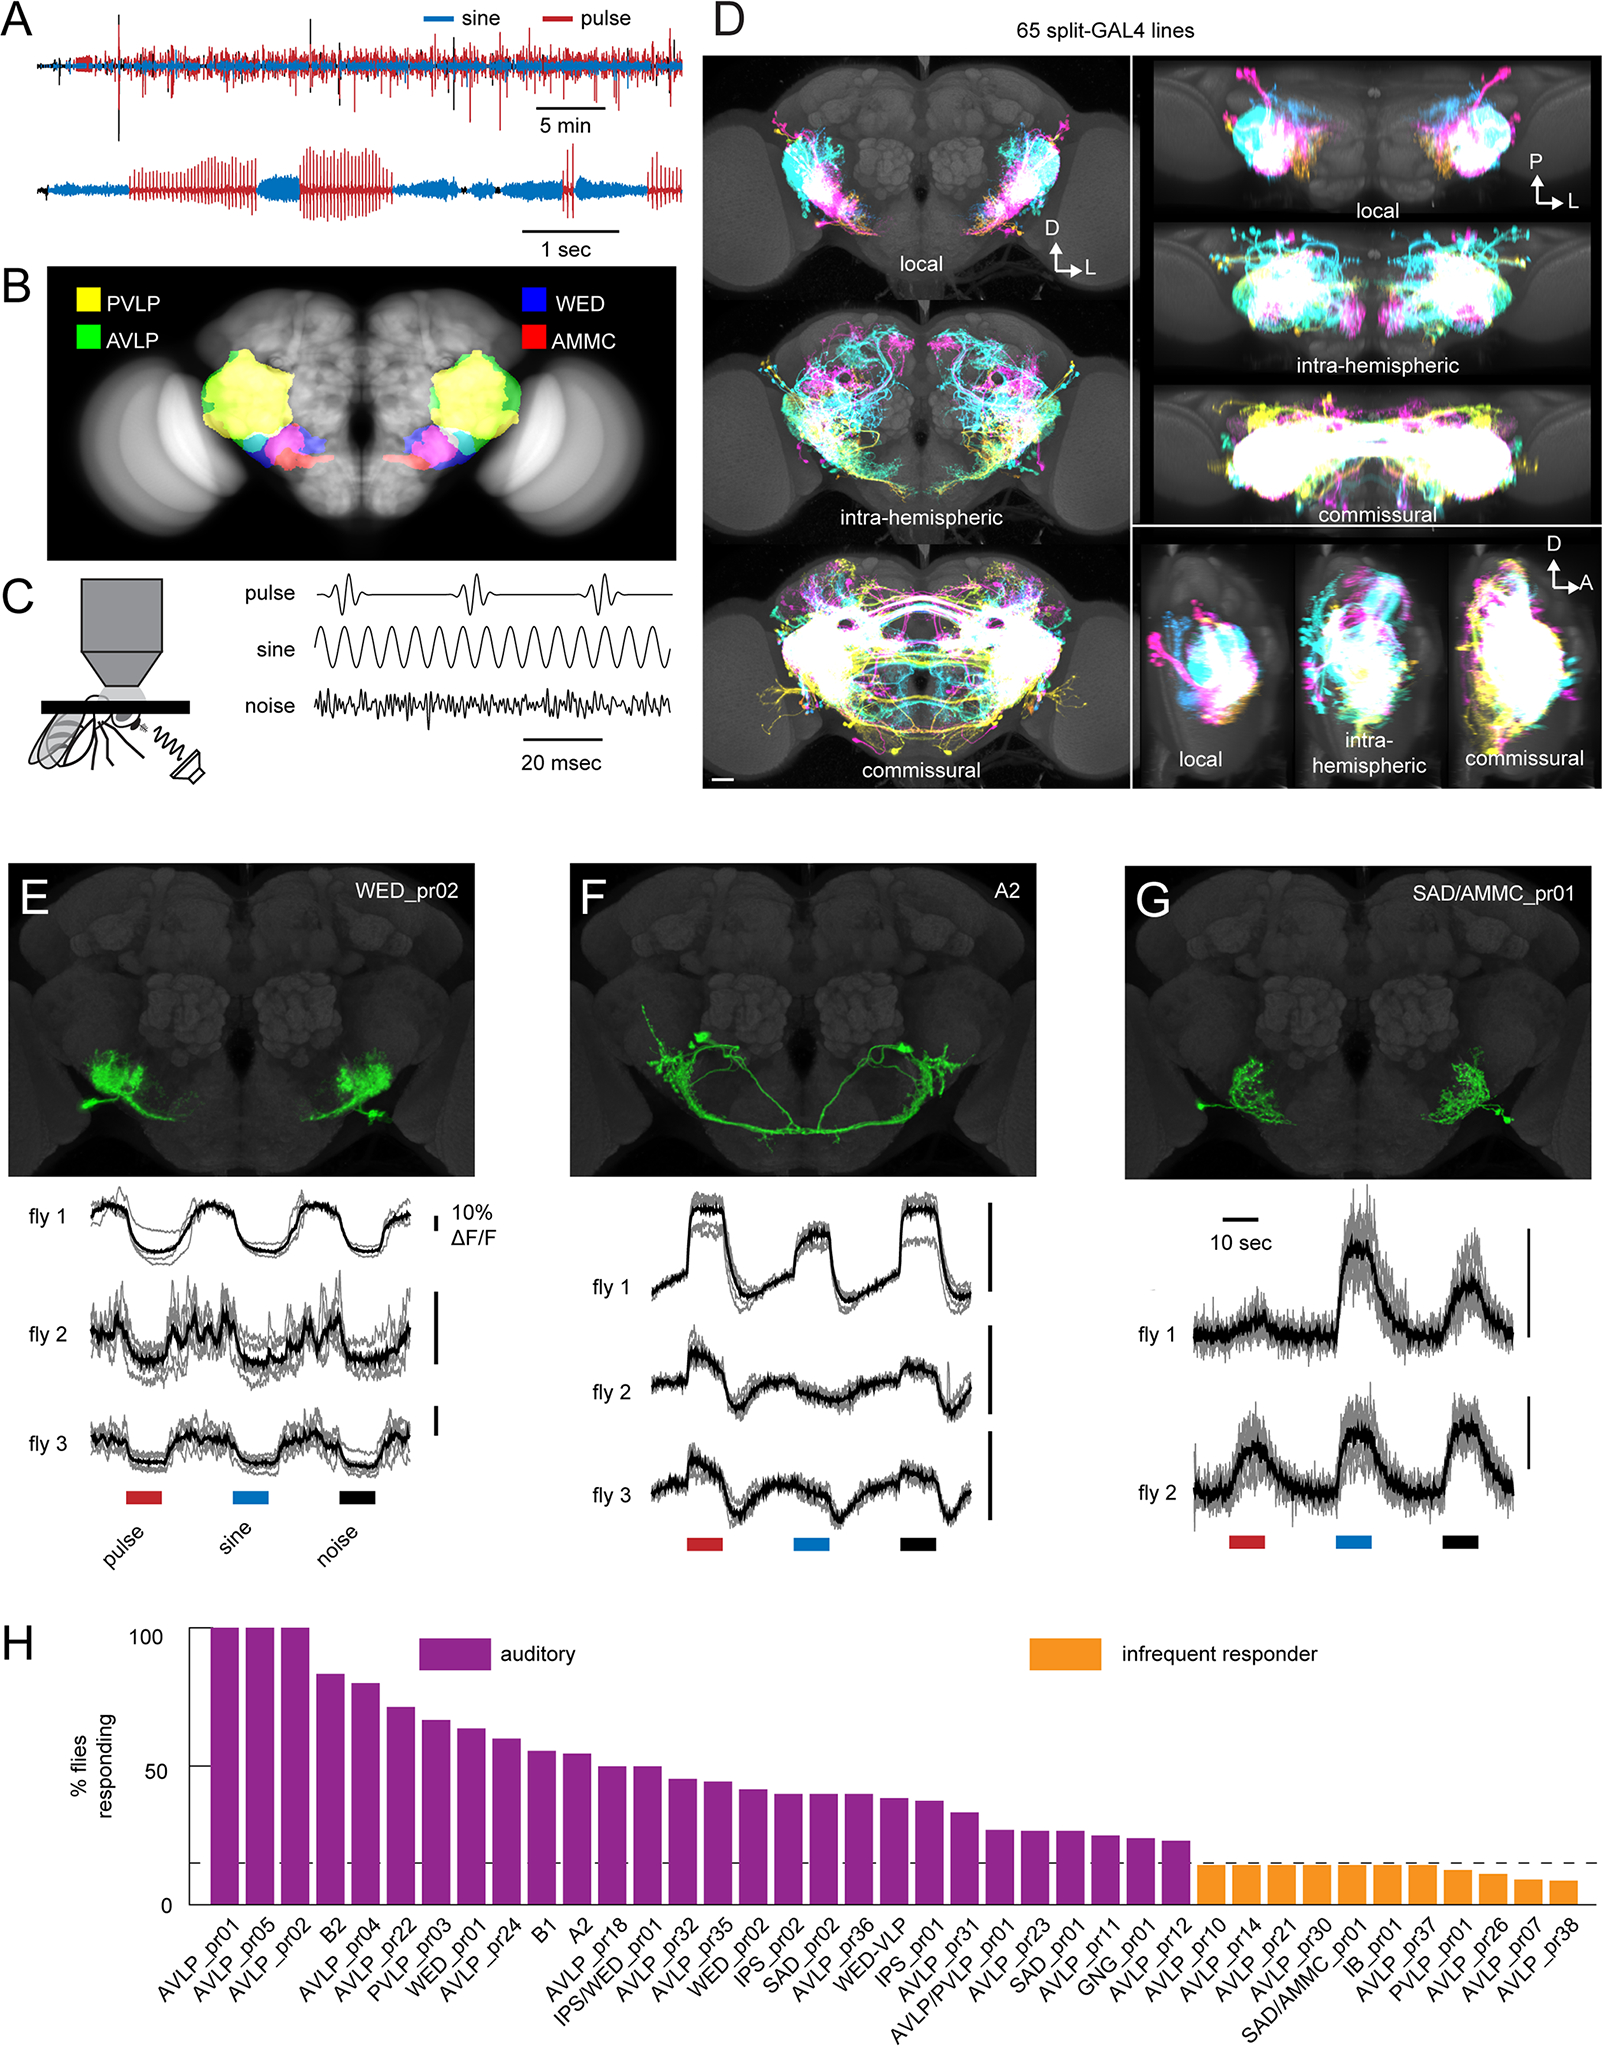
A) Microphone recording from a single wild-type (CS-Tully strain) male fly paired with a virgin female. The top trace shows song over 30 minutes, and the bottom trace shows a close-up of song bouts consisting of switches between the pulse and sine song modes. B) Primary auditory neurons called Johnston Organ neurons in the antenna project to the antennal mechanosensory and motor center (AMMC) in the central brain. Auditory information is then routed to downstream areas including the wedge (WED), anterior ventrolateral protocerebrum (AVLP), and posterior ventrolateral protocerebrum (PVLP). See Table S1 for neuropil abbreviations. C) Schematic showing two-photon calcium imaging set-up with sound delivered to the aristae (left) and calibrated, synthetic acoustic stimuli used to search for auditory responses (right). 100 msec of each stimulus is shown. D) Overlaid images of the split-GAL4 collection’s local interneurons, intra-hemispheric projection neurons, or commissural neurons, segmented from aligned images of the split GAL4 collection (see also Data S1A–B) and shown as maximum projections from the front (left), top (top right), and side (bottom right). Each cell type was colored randomly. D: dorsal; L: lateral; P: posterior; A: anterior. Scale bar: 25 microns. E-G) Calcium responses to pulse, sine, and noise stimuli from three cell classes (see also Figure S1D–E). In the calcium traces, each trial is shown in grey and the mean across trials is shown in black. H) Percentage of imaged flies from each cell class with auditory responses. We defined auditory cell classes as those in which >15% (dotted line) of imaged flies responded to the pulse, sine, or noise stimuli. If at least 1 fly but fewer than 15% of imaged flies responded, we termed the cell class an ‘infrequent responder’. If no flies responded (out of 4–6 total flies), we termed the cell class ‘non-auditory’. Numbers of flies imaged ranged from 4–17 for auditory cell classes, and from 7–23 for infrequently responding cell classes. See Table S2 and Data S1C for cell class images and names. See also Tables S1–2.