
Figure 4. Pulse rate (interpulse interval) and frequency tuning.
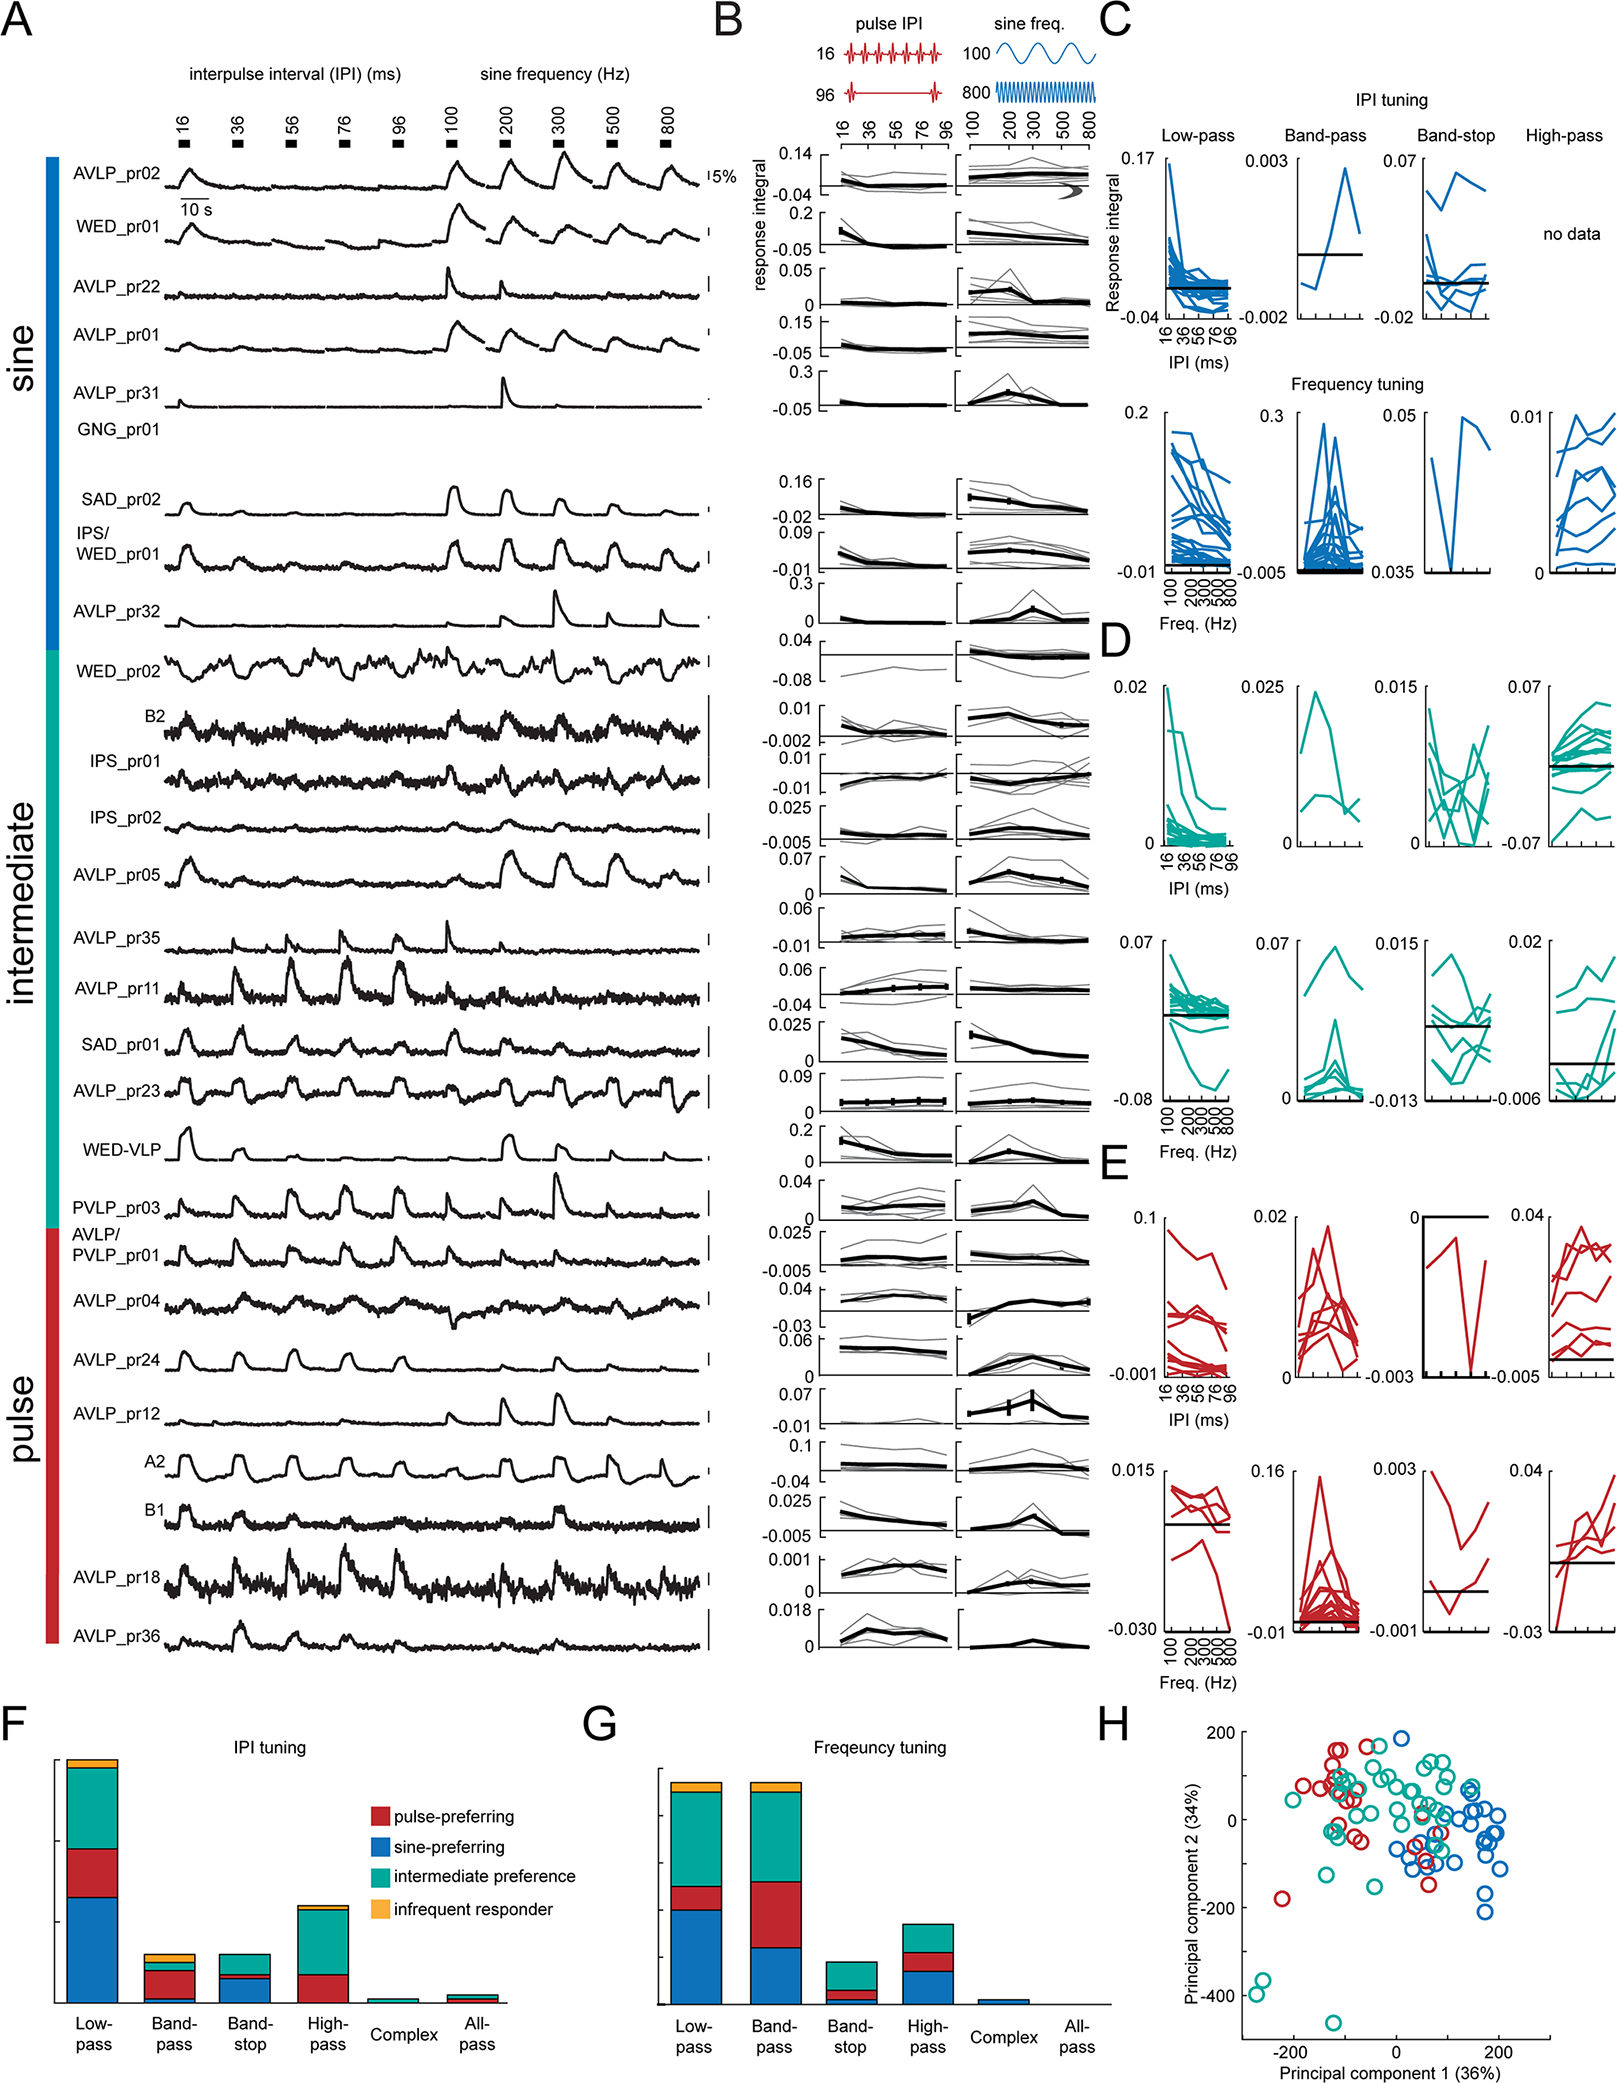
A) Trial-averaged representative calcium traces in response to pulse rate (interpulse interval (IPI)) and sine frequency stimuli. B) Pulse rate (left) and sine frequency (right) tuning curves. The tuning curves from individual flies are shown in grey, and the average across flies is shown in black. Error bars report standard error. C-E) Tuning curves for each fly recorded in the data set. Tuning curves are colored according to the song mode preference of each WED/VLP neuron type. F-G) Histogram of IPI (F) and frequency (G) tuning types across the dataset. Responses that were roughly equal for every stimulus were classified as all-pass, and responses that did not fit any other category were classified as complex (see Methods). H) Principal components analysis (PCA) on the response integrals elicited by IPI and frequency stimuli. Each dot represents one recording, and the color represents the song mode preference for each cell type. PC1 positively correlates with responses to 100 and 200 Hz stimuli, and negatively correlates with responses to 36–96 ms IPI stimuli. PC2 positively correlates with responses to 16 and 36 ms stimuli, and negatively correlates with responses to 100 and 800 Hz stimuli. See also Table S2.