
Figure 6. Evaluating the hierarchical structure of the auditory network and emergence of postsynaptic tuning curves from connectome-weighted presynaptic responses.
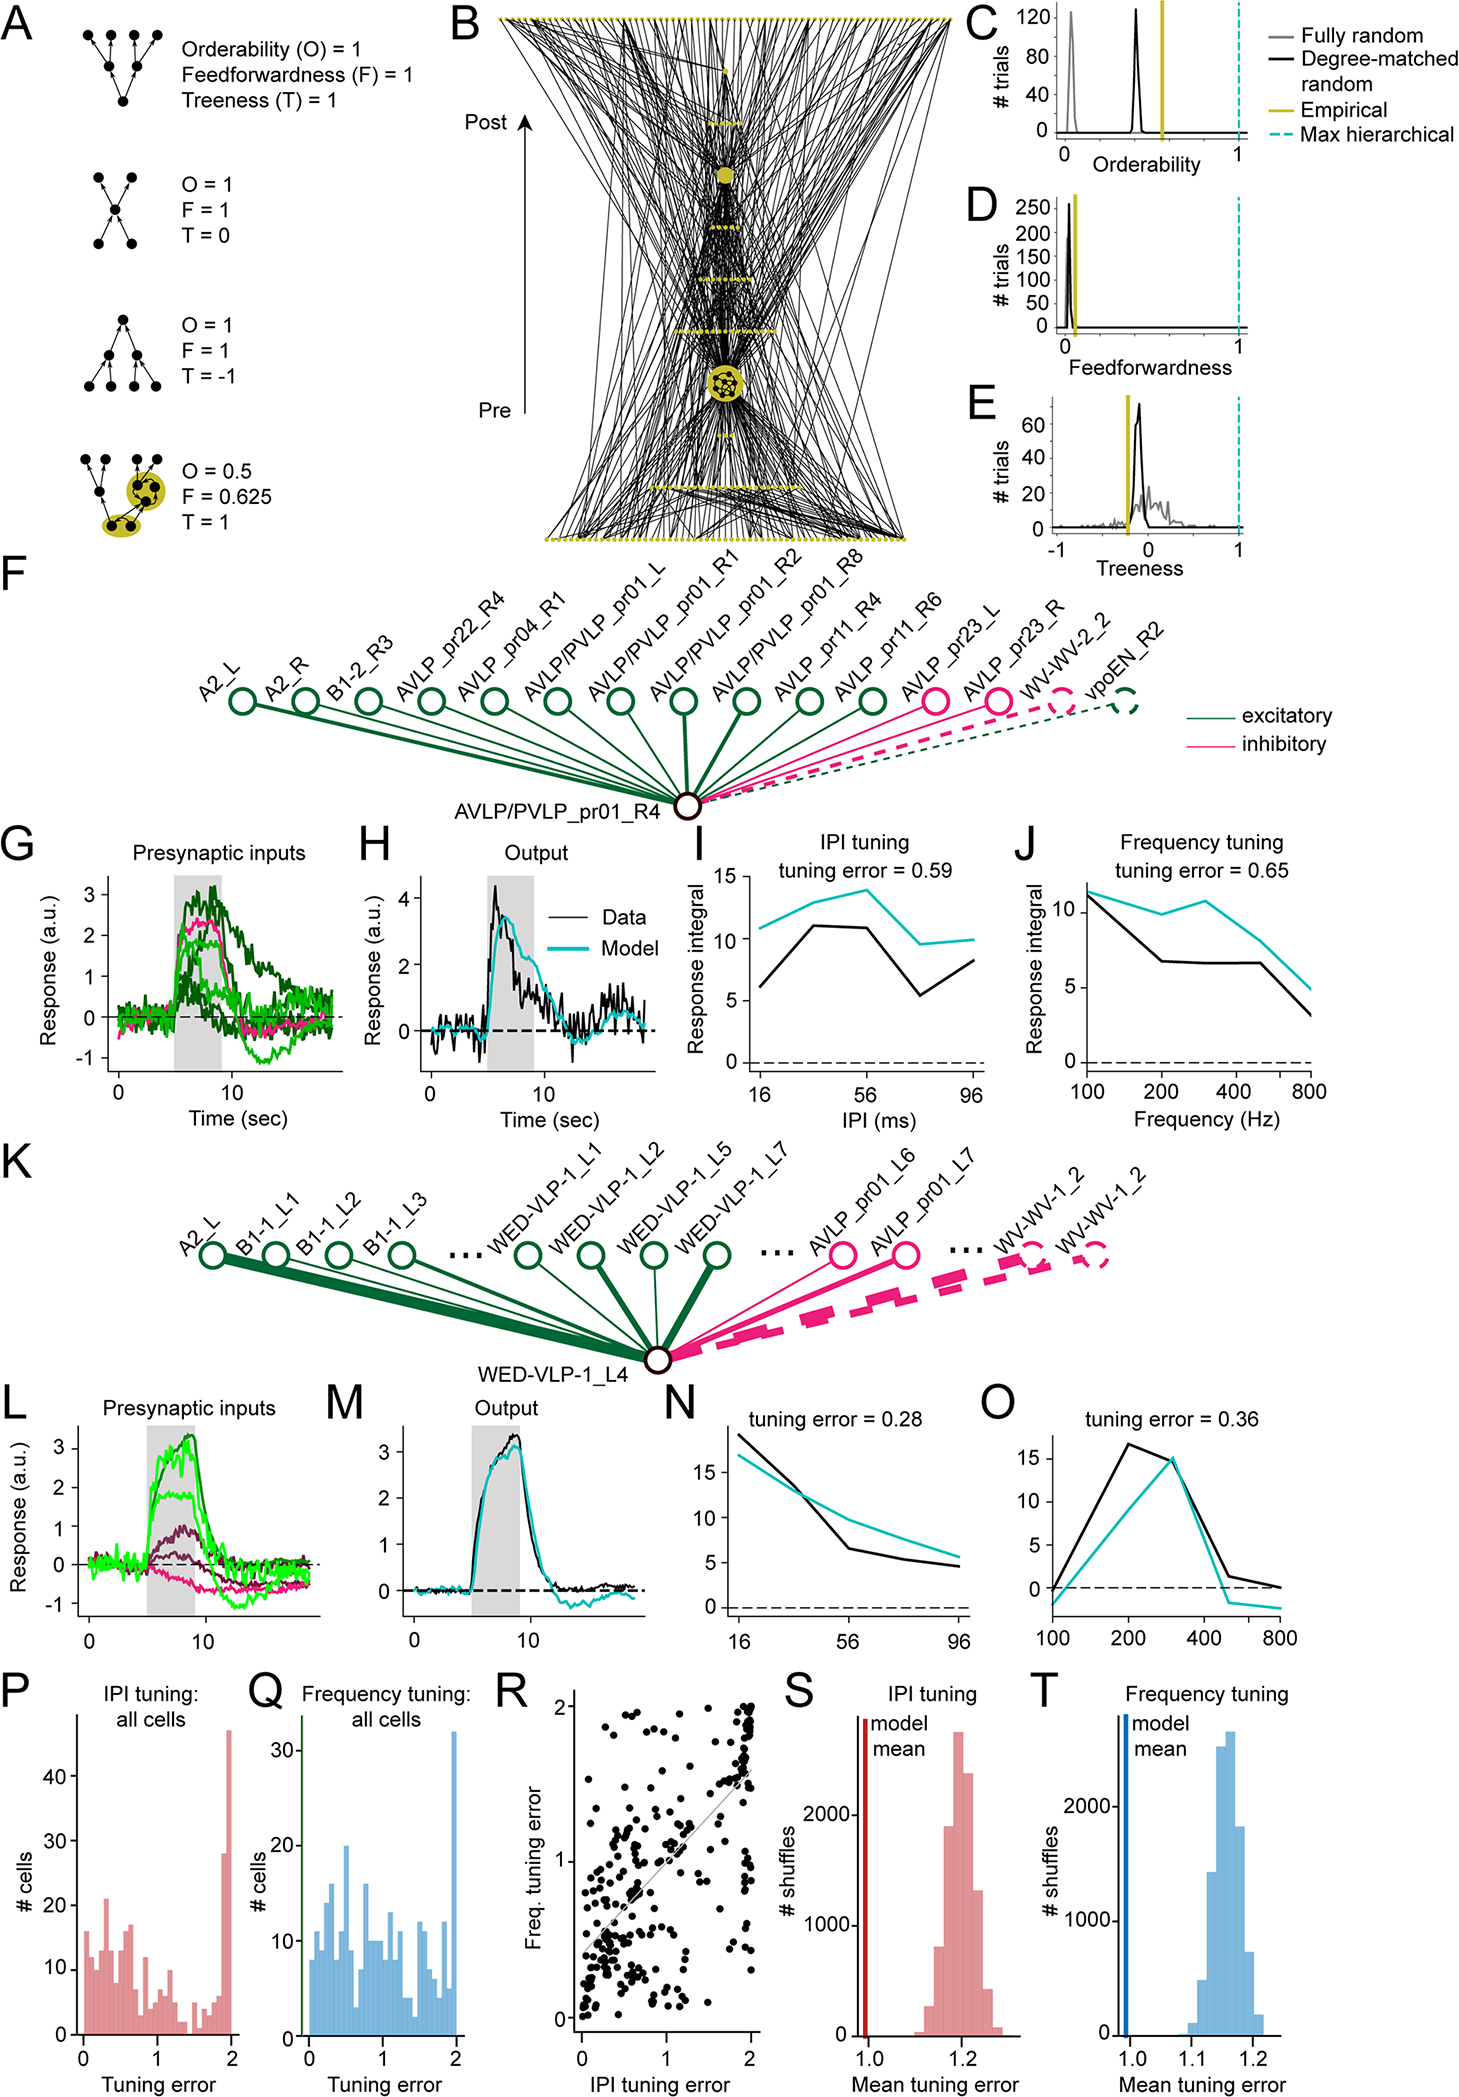
A) Measures of hierarchical structure (orderability, feedforwardness, and treeness) for four simple networks (reproduced from 47); each gold region highlights a strongly connected component (a set of neurons all mutually reachable from one another via at least one directed path). B) Hierarchically displayed node-weighted graph condensation of the empirically measured auditory network. Each node in the condensation is a strongly connected component of the original auditory network, with node size indicating the number of neurons in the component (minimum 1 neuron, maximum 124 neurons). Connections are oriented upward with postsynaptic targets displayed above presynaptic sources. C) Orderability of the auditory network, computed from the original network and the graph condensation (A), as compared to 300 instantiations (trials) of either a fully random network (with only neuron count and connection probability matched to the original auditory network) or degree-matched random network (in which each neuron’s incoming and outgoing connection numbers were inherited from the empirical network but connections were otherwise randomized). D) Feedforwardness of the auditory network, as compared to fully random and degree-matched random networks. The low value arises from most paths passing through the largest connected component. E) Treeness of the auditory network, as compared to fully random and degree-matched random networks. Prior to analysis, connections between two neurons in the original network were only counted if at least 10 synapses were detected (171 out of 476 neurons were unconnected to the main network and left out of the calculations). A maximally hierarchical network has a feedforwardness, orderability, and treeness of 1 (cyan; C-E). F) Schematic of network model used to compute neural responses and tuning for cell AVLP/PVLP_pr01_R4 (lower node). Upper nodes represent input neurons and lines indicate synaptic connections. Solid lines represent inputs from imaged split-GAL4 lines and dotted lines represent inputs from neurons outside our imaging dataset. G) Normalized responses of cells presynaptic to AVLP/PVLP_pr01_R4 (15 total, 2 without tuning data), in response to 36 ms IPI stimulus. Coloring shows weight of presynaptic cell onto postsynaptic cell, with brighter green or red indicating stronger excitatory and inhibitory weights, respectively. The grey box indicates when the stimulus was on. H) Observed postsynaptic response to the same 36 ms IPI stimulus (black) vs response modeled by feeding presynaptic responses through the network model (teal). I) IPI tuning curves from observed and modeled postsynaptic responses, computed by integrating responses from stimulus onset to 4 seconds post stimulus offset. J) Same as (I) for sine frequency tuning. K-O) Same as (F-J) for cell WED-VLP-1_L4 (29 total, 3 without tuning data). Ellipses in (K) indicate additional neurons in the data that we did not have room to show in the diagram. P) Root mean squared error between true and modeled IPI tuning curves across all cells with both post- and presynaptic tuning data (N = 306 cells); tuning curves were z-scored first to compare shape rather than magnitude. Q) Same as (P) for sine frequency tuning curves. R) IPI tuning error vs. sine frequency tuning error across cells (N=306 cells, R = 0.671, p < 10^−39; Wald test with zero-slope null hypothesis). S) Histogram of mean errors computed by shuffling true relative to modeled tuning curves across cells (10000 shuffles, p < 0.0001, computed by counting number of shuffles yielding a mean value less than the observed mean). Vertical line indicates the mean from (P). T) Same as (S) for frequency tuning curves (p < 0.0001). Vertical line indicates the mean from (Q). See also Table S2.