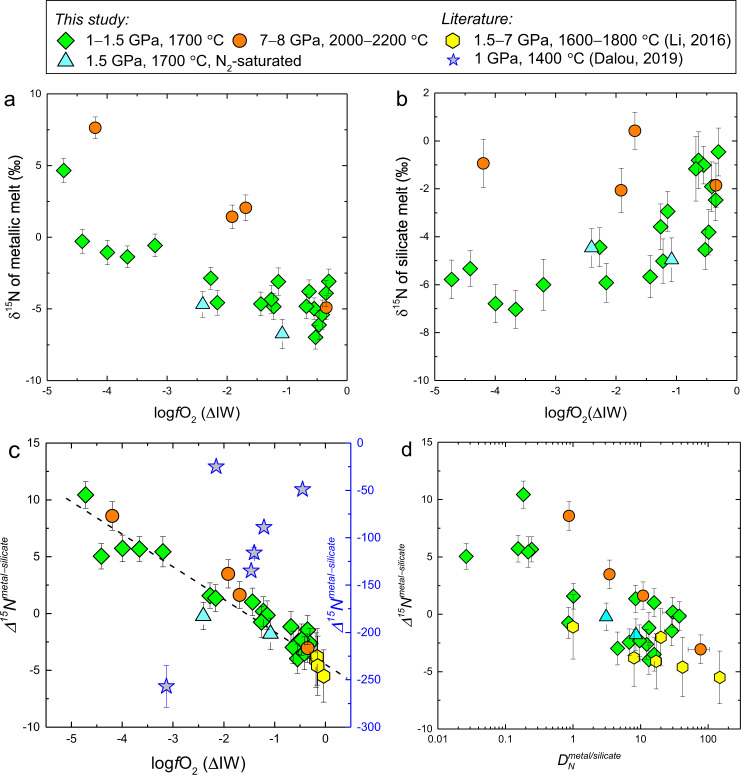
Fig. 3. The N-isotopic composition (δ15N) of the metallic and silicate melts and metal/silicate N-isotopic fractionation (∆15Nmetal-silicate).
a The δ15N of metallic melt increase with decreasing fO2. b The δ15N of silicate melt generally decrease with decreasing fO2. c The ∆15 Nmetal-silicate of this study and Li et al.35 are consistent and mainly controlled by fO2. In the study of Dalou et al.36, ∆15 Nmetal-silicate vary from −49‰ to −257‰ (the gray-filled blue stars and right-hand blue Y axis). The large N-isotopic fractionations observed in Dalou et al.36 could be caused by significant N-loss in their experiments as shown in Supplementary Fig. 5. d The ∆15 Nmetal-silicate and obtained in this study and Li et al.35 are negatively correlated. More explanations for these data are given in “Methods”. Source data are provided in Supplementary Data 2–4.

