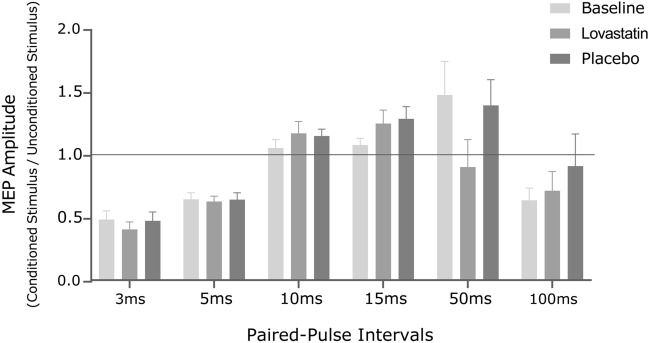
Figure 2.
MEP peak-to-peak amplitude ratios for SICI3ms, SICI5ms, ICF10ms, ICF15ms, LICI50ms and LICI100ms, at baseline and after lovastatin and placebo administration. The horizontal line represents a null effect, wherein conditioned stimulus amplitude equals the amplitude from baseline pulses. Inhibition occurs for bars below the horizontal line, whereas excitation stands above the line. MEP motor-evoked potential, ms millisecond.

