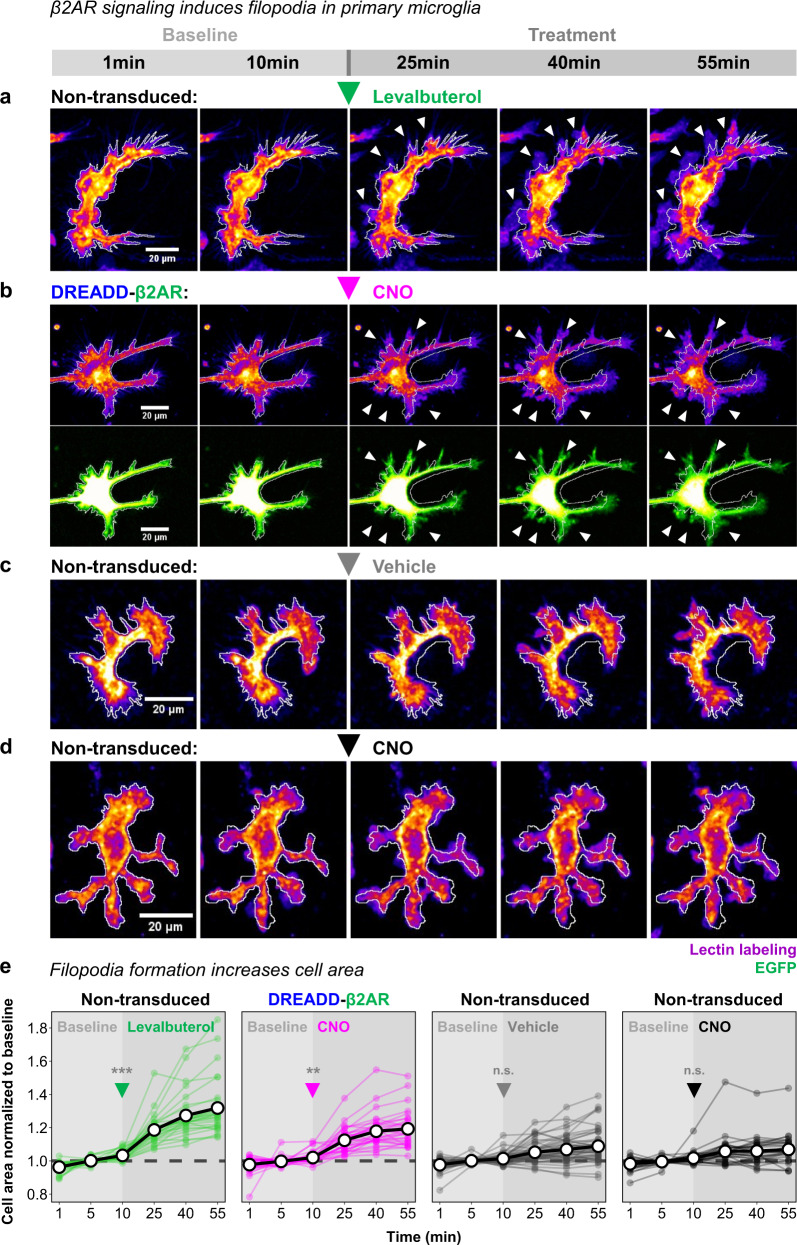
Fig. 6. Stimulation of DREADD-β2AR induces filopodia formation in primary microglia.
a, d Representative images of primary microglia during 55 min of live imaging. After a 10 min baseline, non-transduced cells were stimulated with either levalbuterol (a), vehicle (c), or CNO (d). Cells transduced with DREADD-β2AR-P2A-EGFP (b) were treated with CNO after 10 min of baseline recording. Lectin labeling visualized with an intensity-based color code (purple-red-yellow) to display signals of varying intensities. Green: EGFP visualized with intensity-based color code (green-white). White outline: cell area perimeter at 1 min projected on all other shown time points. White arrow heads: filopodia formation. e Quantification of cell area changes throughout 55 min of live imaging. A 10 min baseline was followed by ligand application (arrow heads for onset) of either levalbuterol, CNO, or vehicle. Graphs show the fold change of individual cells normalized to their baseline mean at selected time points of 1, 5, 10, 25, 40, and 55 min. Thick black lines: mean of all cells (30–50 per experimental group). Thin colored lines: individual cells. Dashed lines: baseline mean. Linear regression analysis modeling cell area (µm2) of individual cells across time to compare baseline with treatment period: ***p < 0.001; **p < 0.01; n.s.p > 0.05. Two-sided post-hoc comparisons corrected for multiple testing: p < 0.001 (Non-transduced: Levalbuterol); p = 0.004 (DREADD-β2AR: CNO); p = 0.58 (Non-transduced: Vehicle); p = 0.84 (Non-transduced: CNO). N = 30 (Non-transduced: Levalbuterol), 32 (DREADD-β2AR: CNO), 50 (Non-transduced: Vehicle), 30 (Non-transduced: CNO) cells examined over three, ten, nine, and eight experiments, respectively. Source data are provided as a Source Data file.

