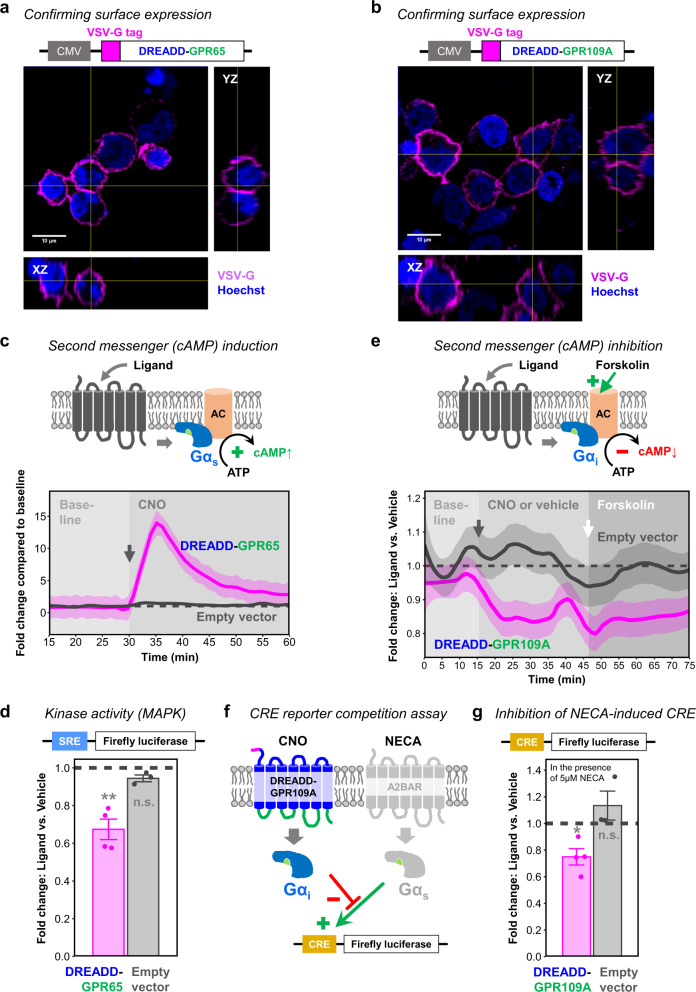
Fig. 7. DREADD-GPR65 and DREADD-GPR109A respond with their expected signaling cascades.
a, b Orthogonal view of HEK cells transfected with DREADD-GPR65 (a) or DREADD-GPR109A (b) immunostained for the VSV-G tag under non-permeabilizing conditions. Magenta: VSV-G tag. Blue: nuclear staining with Hoechst. CMV, human cytomegalovirus promoter. c Top: Schematic of Gαs-coupled GPCR inducing cAMP synthesis after ligand stimulation through adenylyl cyclase (AC) activation. Below: Real-time measurement of cAMP-dependent luciferase activity in HEK cells transfected with DREADD-GPR65 (magenta) or empty vector (gray). Baseline measurement of 30 min (first 15 min not shown) followed by CNO application (gray arrow for onset). Measure of center: Mean fold change compared to baseline mean (dashed line) in the same experimental repetition. Ribbons: 95% confidence intervals. N = four (DREADD-GPR65) or seven (Empty vector) experimental repetitions. Source data are provided as a Source Data file. d Endpoint measurement of serum responsive element (SRE)-dependent luciferase activity in HEK cells transfected with DREADD-GPR65 (magenta) or empty vector (gray). Ligand stimulation with CNO. Dashed line: level of the respective vehicle control. Error bars: standard error of the mean. Two-sided one-sample T-test for comparing to a mean of 1 representing the vehicle control: *p < 0.05; n.s.p > 0.05. Exact p-values of individual T-tests without multiple testing correction: p = 0.009 (DREADD-GPR65); p = 0.09 (Empty vector). N = four (DREADD-GPR65) or three (Empty vector) experimental repetitions. Source data are provided as a Source Data file. e Top: Schematic of Gαi-coupled GPCR reducing cAMP levels after ligand stimulation through adenylyl cyclase (AC) inhibition. Forskolin induces cAMP synthesis through AC activation. Below: Real-time measurement of cAMP-dependent luciferase activity in HEK cells transfected with DREADD-GPR109A (magenta) or empty vector (gray). Baseline measurements followed by application of CNO or vehicle (gray arrow for onset) and forskolin (white arrow for onset). Measure of center: Mean fold change compared to vehicle (dashed line) in the same experimental repetition. Ribbons: 95% confidence intervals. N = five experimental repetitions. Source data are provided as a Source Data file. f Schematic of competition assay between Gαi-coupled DREADD-GPR109A and Gαs-coupled A2B adenosine receptor (A2BAR). Simultaneous stimulation of Gαi through CNO and Gαs through NECA prevents cAMP-responsive element (CRE)-mediated luciferase reporter activity. g Endpoint measurement of CRE-dependent luciferase activity in HEK cells transfected with DREADD-GPR109A (magenta) or empty vector (gray). Simultaneous stimulation with CNO and 5 µM NECA. Dashed line: level of the respective vehicle control. Error bars: standard error of the mean. Two-sided one-sample T-test for comparing to a mean of 1 representing the vehicle control: *p < 0.05; n.s.p > 0.05. Exact p-values of individual T-tests without multiple testing correction: p = 0.03 (DREADD-GPR109A); p = 0.34 (Empty vector). N = three (DREADD-GPR109A) or four (Empty vector) experimental repetitions. Source data are provided as a Source Data file.

