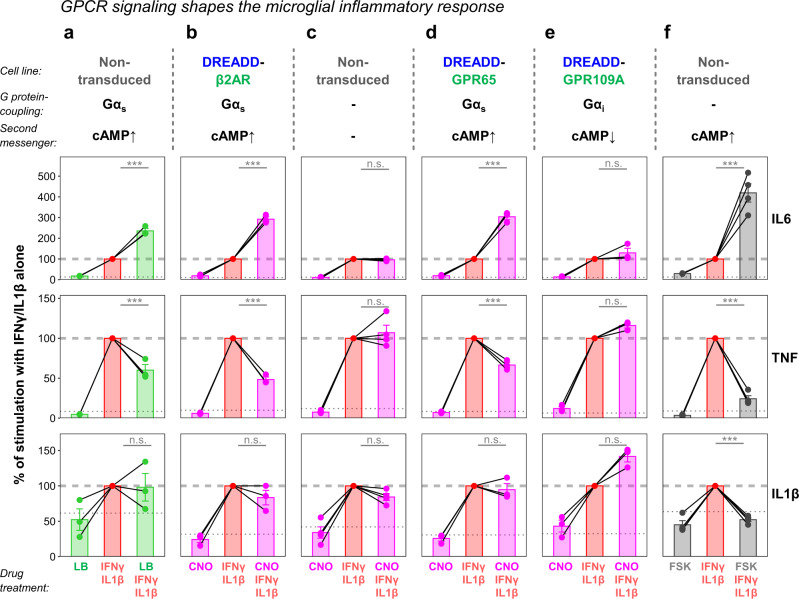
Fig. 8. DREADD-based chimeras modulate expression of key inflammatory genes.
a–f Quantitative reverse transcription PCR (RT-qPCR) for interleukin 6 (IL6, top row), tumor necrosis factor (TNF, middle row), and interleukin 1β (IL1β, bottom row). Different HMC3 cell lines simultaneously treated with recombinant interferon γ (IFNγ) and interleukin 1β, and combinations of levalbuterol (LB, a), CNO (b–e), or forskolin (FSK, f). Graphs show fold changes compared to untreated cells with the IFNγ/IL1β treatment set to 100% within each repetition (dashed line). Dotted line: level of untreated controls. Lines connecting dots: dependent samples within experimental repetitions. Error bars: standard error of the mean. Linear regression analysis with two-sided post-hoc comparisons corrected for multiple testing: ***p < 0.001; n.s.p > 0.05. Exact p-values: p < 0.001 (a IL6); p < 0.001 (a TNF); p = 0.96 (a IL1β); p < 0.001 (b IL6); p < 0.001 (b TNF); p = 0.62 (b IL1β); p = 0.94 (c IL6); p = 0.79 (c TNF); p = 0.60 (c IL1β); p < 0.001 (d IL6); p < 0.001 (d TNF); p = 0.93 (d IL1β); p = 0.22 (e IL6); p = 0.64 (e TNF); p = 0.18 (e IL1β); p < 0.001 (f IL6); p < 0.001 (f TNF); p < 0.001 (f IL1β). See Supplementary Data 3 for exact p-values of all comparisons. N = three (a, b, d, e) or four (c, f) experimental repetitions. Source data are provided as a Source Data file.

