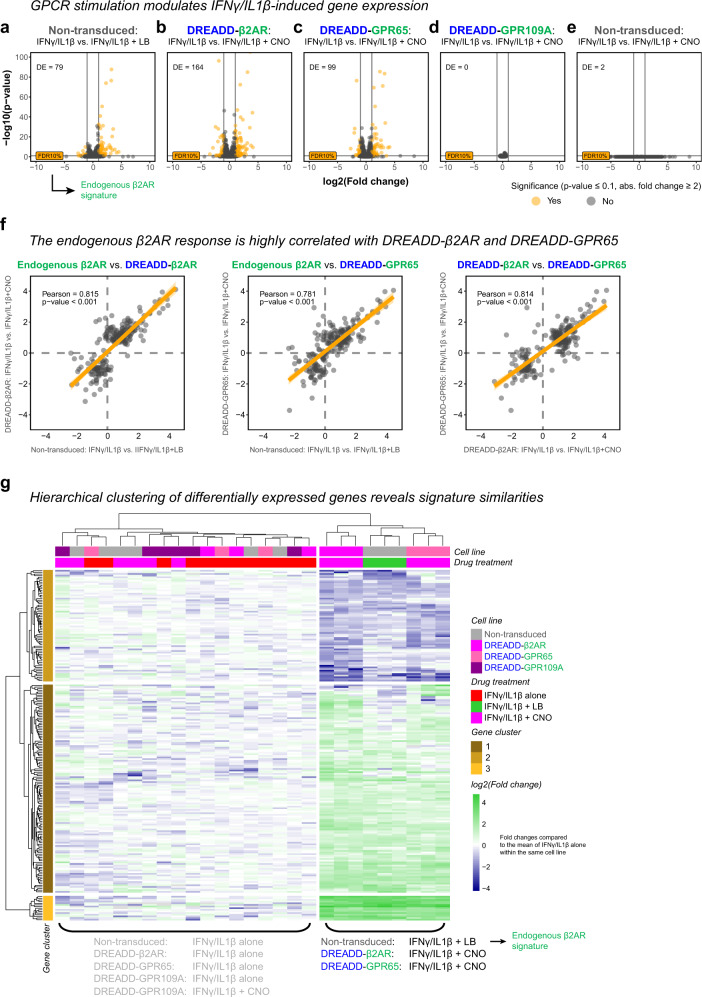
Fig. 9. DREADD-based chimeras shape the inflammatory response and recapitulate the β2AR signature with high similarity.
a–e Vulcano plots of next generation mRNA sequencing data from different HMC3 cell lines simultaneously treated with IFNγ/IL1β, and either levalbuterol (LB) or CNO. Graphs show individual genes (points), their log2 fold change and p-value in comparison to IFNγ/IL1β alone in the same cell line. DE: number of differentially expressed genes (orange data points) defined by p < 0.1 and absolute linear fold change > 2. Horizontal lines: false discovery rate (FDR) cutoff of 10% (p < 0.1). Vertical lines: linear fold change cutoff for downregulation (<−2) and upregulation (>2), respectively. Source data are provided as a Source Data file. f Pearson correlation of GPCR signatures across all differentially expressed genes (dots) shown in a–c based on their log2 fold change compared to IFNγ/IL1β alone in the same cell line. Orange line and ribbon: fitted linear model with 95% confidence intervals. Pearson correlation coefficients: 0.815 (Endogenous β2AR vs. DREADD-β2AR; p < 0.001); 0.781 (Endogenous β2AR vs. DREADD-GPR65; p < 0.001); 0.814 (DREADD-β2AR vs. DREADD-GPR65; p < 0.001). Source data are provided as a Source Data file. g Hierarchical clustering of samples (columns) and all differentially expressed genes (rows) shown in a–c based on log2 fold changes. Upregulation (green) and downregulation (blue) compared to IFNγ/IL1β alone in the same cell line. Source data are provided as a Source Data file.

