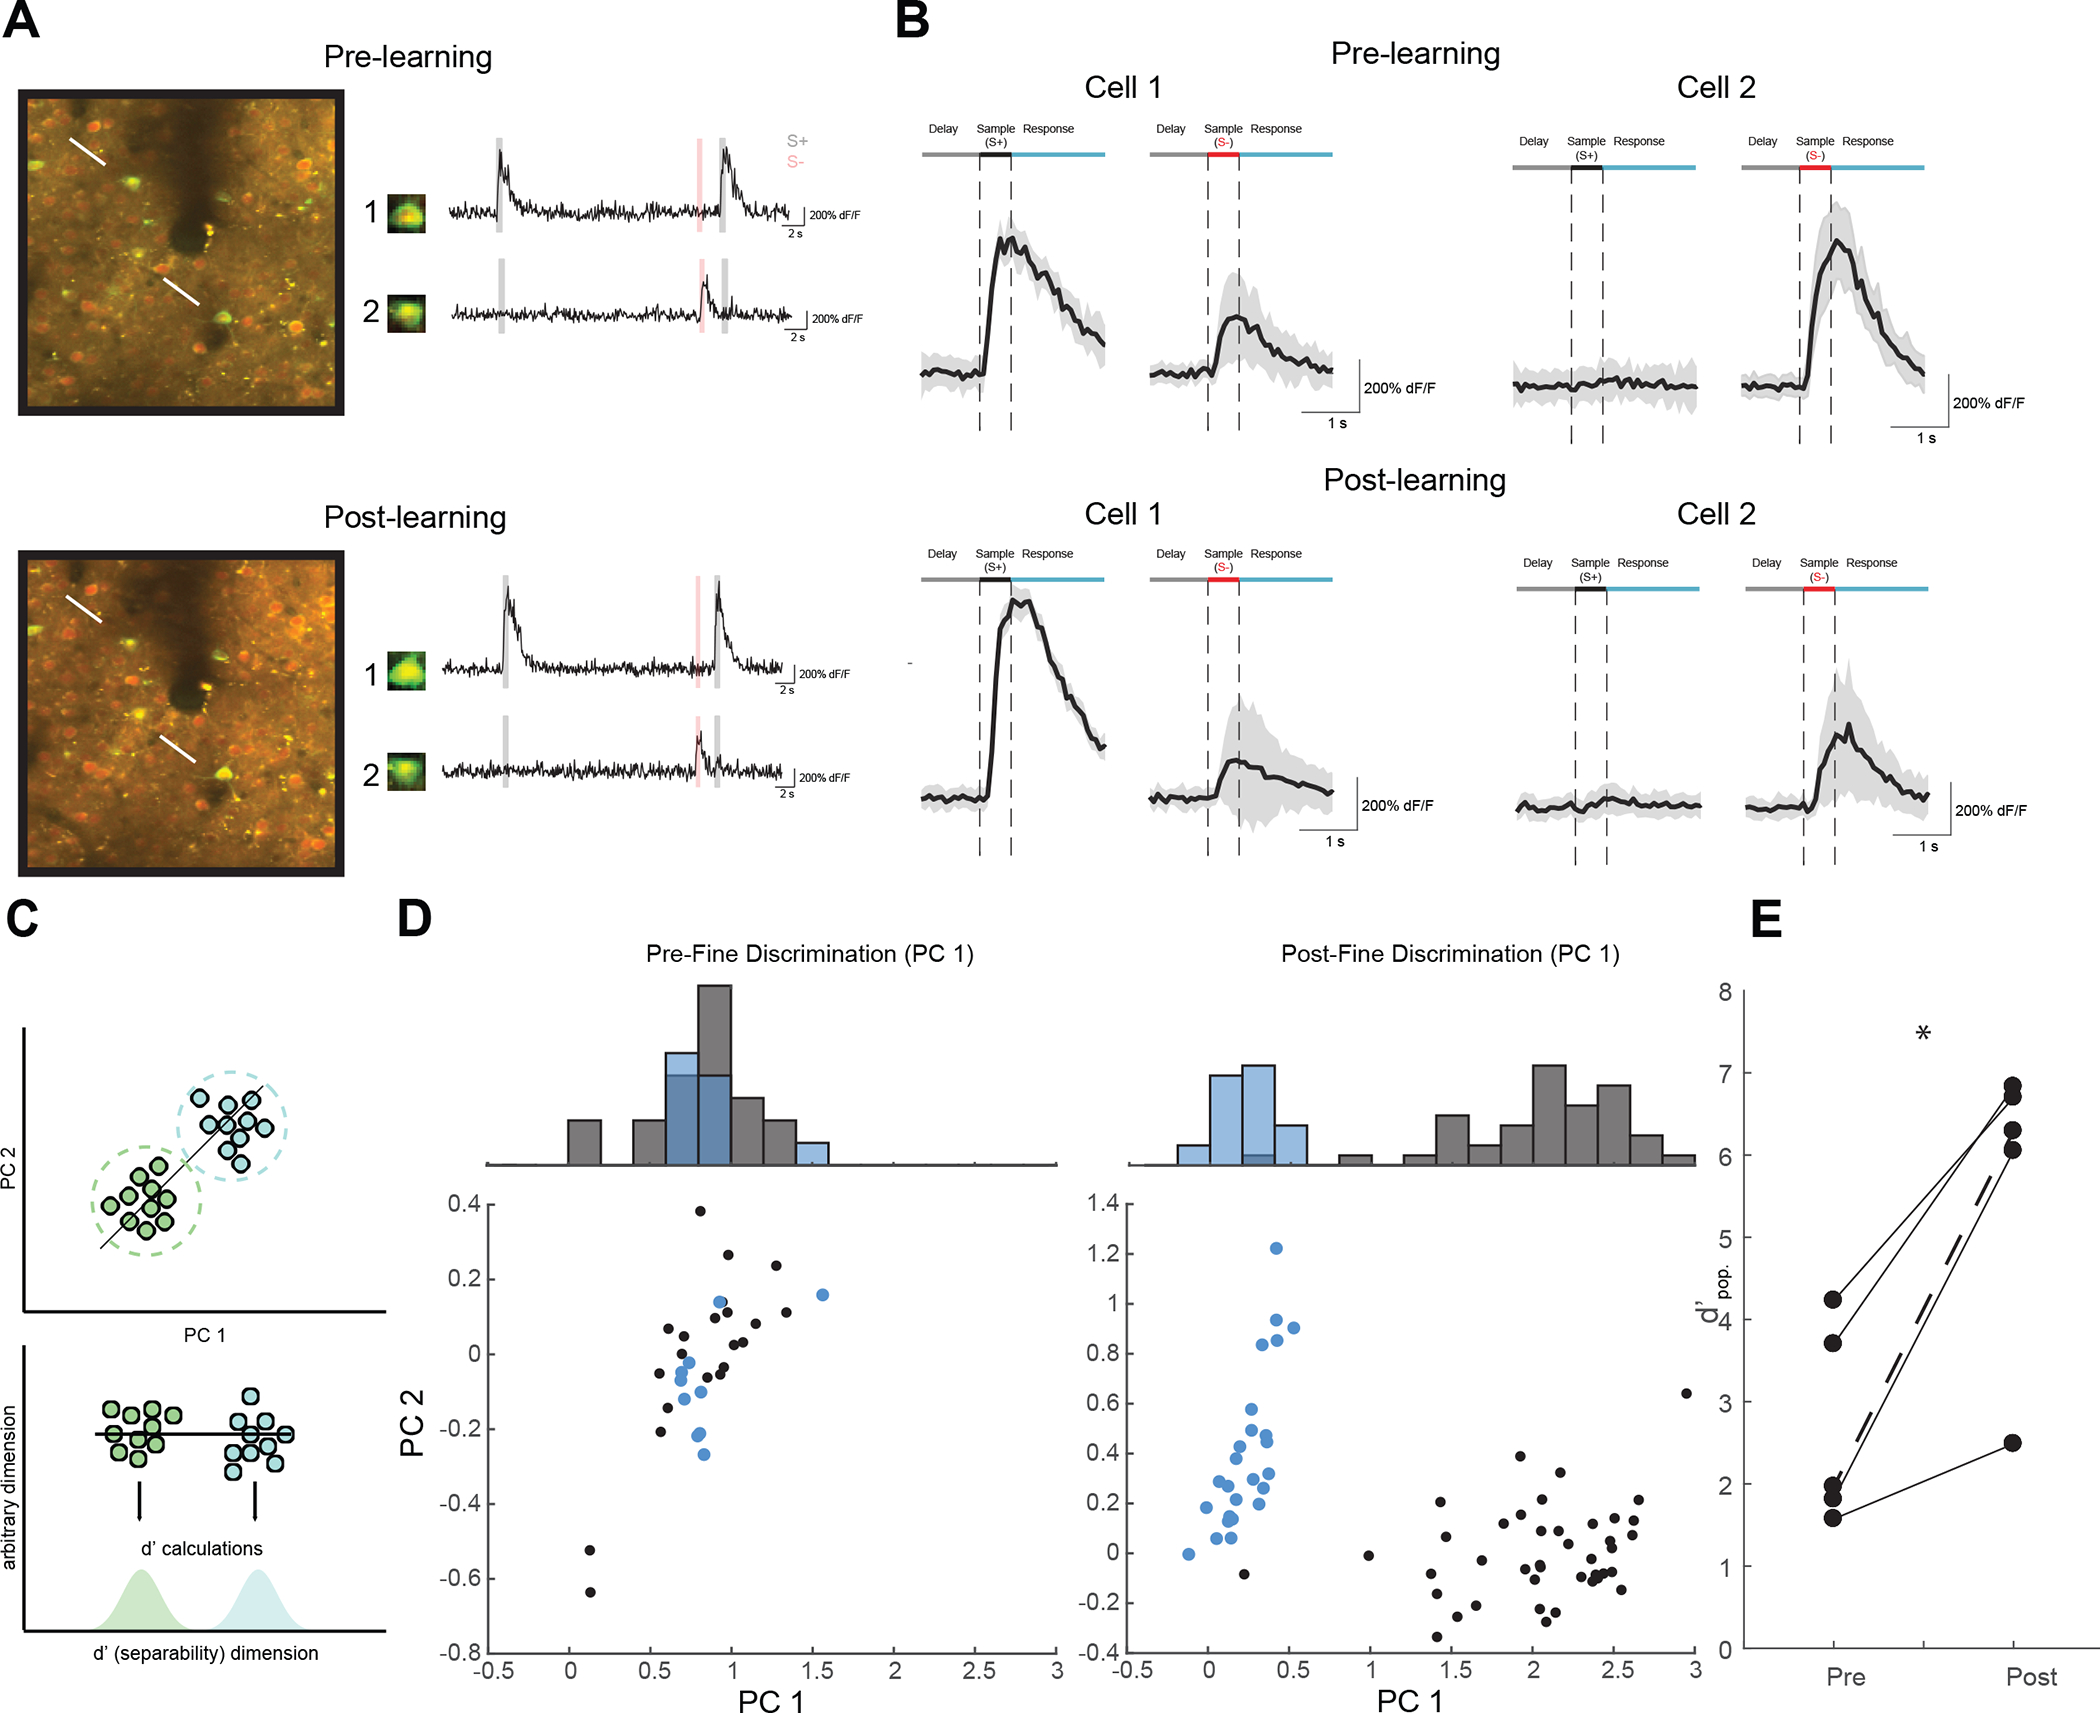
Figure 2: Tracking neural populations over the time reveals learning-related enhancement of neural population discrimination.

(A) Neural response properties were measured at pre- (top) and post-learning (bottom) time points during learning. The neurons within the same field of view were identified across sessions. Example neural response traces for tracked cell bodies are shown as raw dF/F traces (right). (B) Mean stimulus locked traces (+/− SEM) for example neurons in a.. Cell 1 was an S+ selective cell that became more selective over time. Cell 2 was an S− selective cell that became less selective over time. See also Figure S2 (C) Schematic of neural population discrimination. Individual population responses are color coded by stimuli and plotted by their first 2 principle components (top). Each data point (individual trial) was then projected onto the vector connecting the mean response to each stimulus, and d’ measures were computed via the 1-d projection distributions (bottom) (D) Population responses for an example animal before and after learning in neural discrimination space (bottom) and marginal histogram (top). Pre-learning (left) the S+ (Black) and 22.5 degree S− (blue) are highly overlapping. In the post-learning recording (right) the S+ is highly separable from the S− distribution. (E) Five animals display a positive Δd’pop. between pre- and post-learning recordings (*p<0.05, paired t-test). The example animal from D. is shown as a dashed line.
