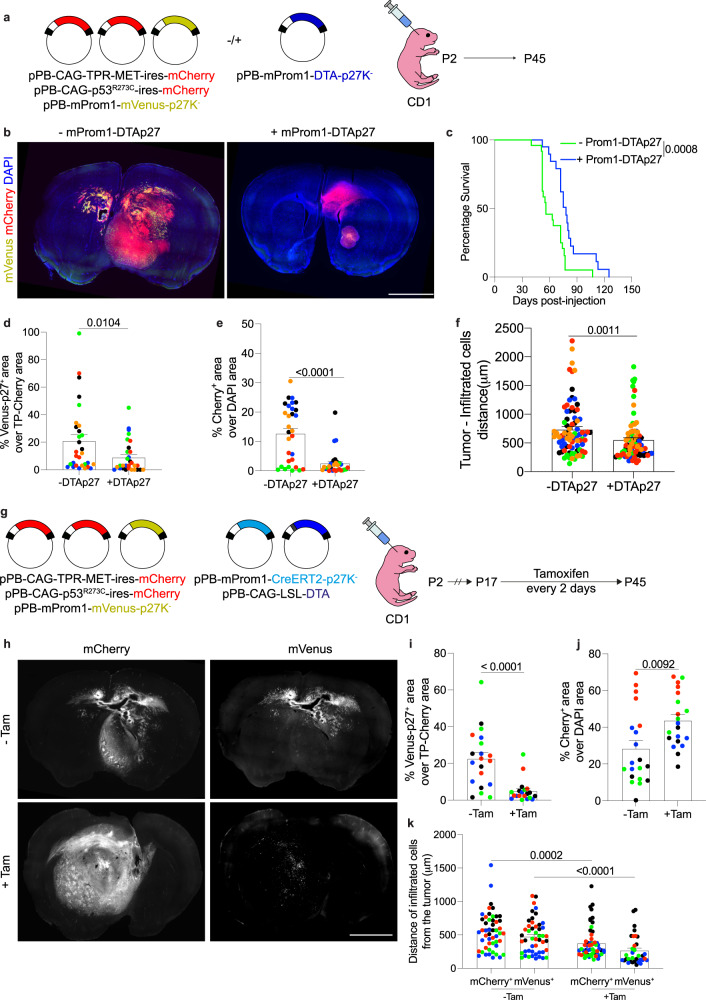
Fig. 4. Ablation of quiescent Prom1+ cells reduces infiltration in TP-induced tumors.
a Electroporation of cells in the SVZ of P2 CD1 mice with pPB-CAG-TPR-MET-ires-mCherry, pPB-CAG-p53R273C-ires-mCherry and pPB-mProm1-mVenus-p27K− with or without pPB-mProm1-DTA-p27K−. b Images of brain sections showing Prom1-Venus-p27 expressing cells within the tumor (mCherry+) of mice co-electroporated without (n = 5 mice) or with (n = 5 mice) pPB-mProm1-DTA-p27K− (Prom1-DTA-p27). c Survival curve of mice injected with pPB-CAG-TPR-MET-ires-mCherry, pPB-CAG-p53R273C-ires-mCherry and pPB-mProm1-mVenus-p27K− without (n = 23 mice) or with pPB-mProm1-DTA-p27K− (n = 18 mice). d, e Quantifications of mVenus+ (green) (d) and mCherry+ (red) (e) area in the brain sections of mice co-electroporated without (n = 5 mice) or with (n = 5 mice) Prom1-DTA-p27. Each dot represents a brain section and color code is applied to each mouse. f Quantification of the distance of the infiltrated mCherry+ cells from the tumor edge in the brain sections of mice co-electroporated without (n = 5 mice) or with (n = 5 mice) Prom1-DTA-p27. The furthest 3 cells for each section were considered; each dot represents a cell and color code is applied to each mouse. g Electroporation of cells in the SVZ of P2 CD1 mice with pPB-CAG-TPR-MET-ires-mCherry, pPB-CAG-p53R273C-ires-mCherry, pPB-mProm1-mVenus-p27K−, pPB-mProm1-CreERT2-p27K− and pPB-CAG-LSL-DTA. Mice were injected with Tamoxifen every two days from P17 to P45. h–j, Images (h) and quantifications of mVenus+ (green) (i) and mCherry+ (red) (j) area in the brain sections of mice un-injected (n = 4) or injected (n = 4 mice) with Tamoxifen (Tam). Each dot represents a brain section and color code is applied to each mouse. k Quantification of the distance of the infiltrated mCherry+ or mVenus+ cells from the tumor edge in the brain sections of mice un-injected (n = 4 mice) or injected (n = 4 mice) with Tamoxifen. The furthest 3 cells for each section were considered; each dot represents a cell and color code is applied to each mouse. Scale bars (b, h) 2 mm. Data are presented as mean ± SEM. P values were calculated by unpaired two-tailed non-parametric Mann–Whitney test (d, e, f, i, k) or unpaired two-tailed Student’s t test (j). Kaplan–Meier survival curve followed by Log-rank (Mantel-Cox) test was used for testing difference in the survival of mice (b). Source data are provided as a Source Data file.

