
Figure 3: Dupilumab-induced changes in nasal and urinary eicosanoids.
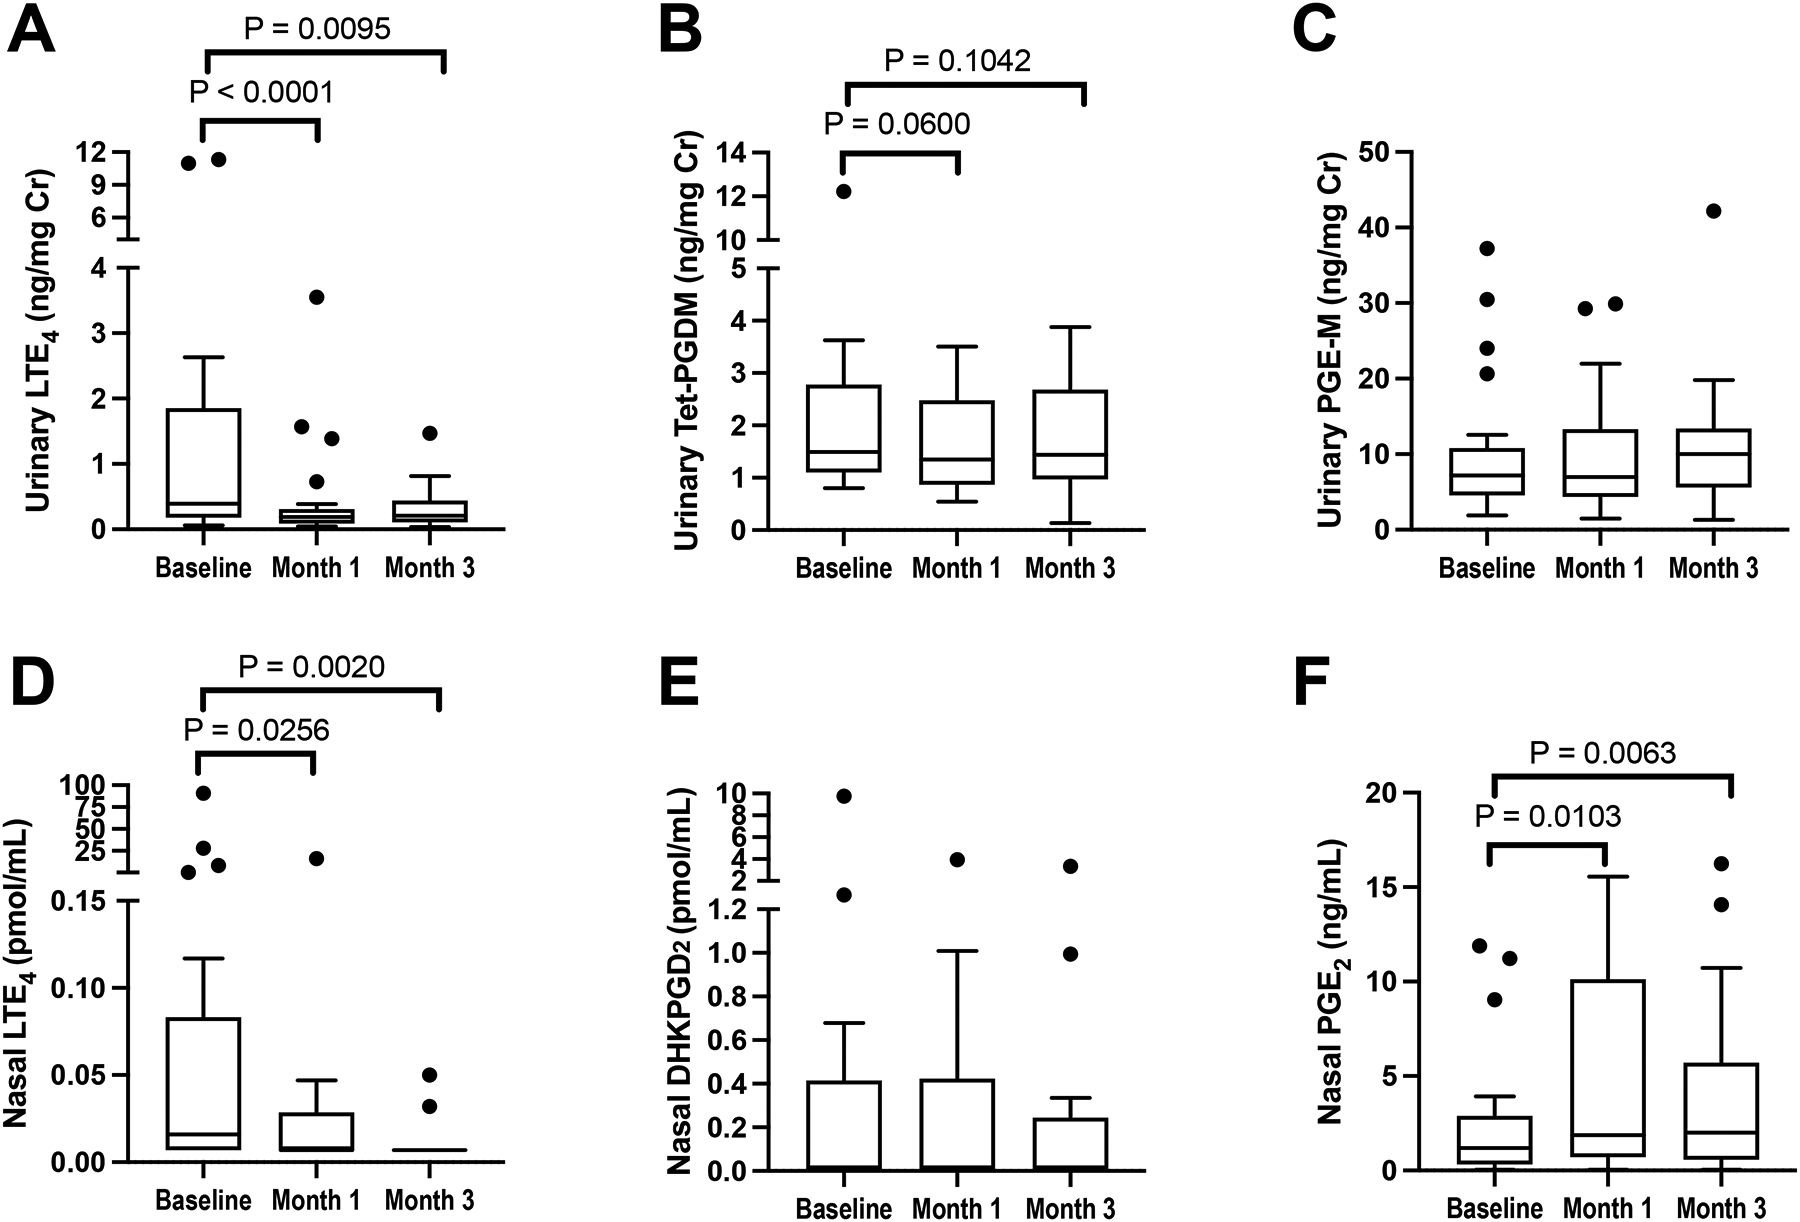
Urinary levels of LTE4, tetranor-PGDM, and PGE-M (A-C), and nasal fluid levels of LTE4, DHKPGD2, and PGE2, (D-E) are shown at the pre-dupilumab baseline, and after 1 and 3 months of treatment with dupilumab. Data are shown as Tukey’s box-and-whisker plots, analysis with Wilcoxon signed-rank test, N = 22 participants.