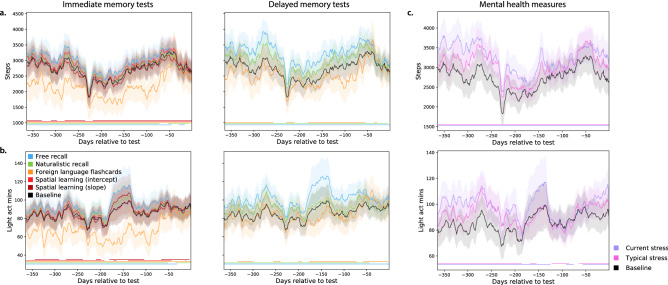
Figure 6.
Dynamics of physical activity vary with memory performance and mental health measures. (a) Daily step counts. Each timecourse is weighted by either performance on immediate recall tests (left panel) or on delayed recall tests (right panel). The black (baseline) timecourses display the (unweighted) average across all participants. (b) Daily duration (in minutes) of low-intensity physical activity. Timecourses are displayed in the same format and color scheme as those in panel a. Analogous timecourses for additional fitness-related measures may be found in Figs. S15, S16, and S17. (c) Timecourses of physical activity, weighted by mental health measures. The timecourses in each panel display the average daily step counts (top panel) or duration of low-intensity activity (bottom panel). The colored lines show average activity dynamics weighted by self-reported stress levels at the start of the experiment (purple) and self-reported “typical” stress levels (pink). The baseline curves (black) display the average across all participants (re-plotted in panel c to illustrate scale differences across panels). Timecourses for additional mental health-related and fitness-related measures may be found in Figs. S18, S19, and S20. Error ribbons in all panels denote the standard error of the mean. Horizontal lines below each panel’s timecourses denote intervals over which each weighted measure (color) differs from the unweighted baseline (via a paired sample two-sided t-test of the weighted mean values for each measure within a 30-day window around each timepoint; horizontal lines denote , corrected).

