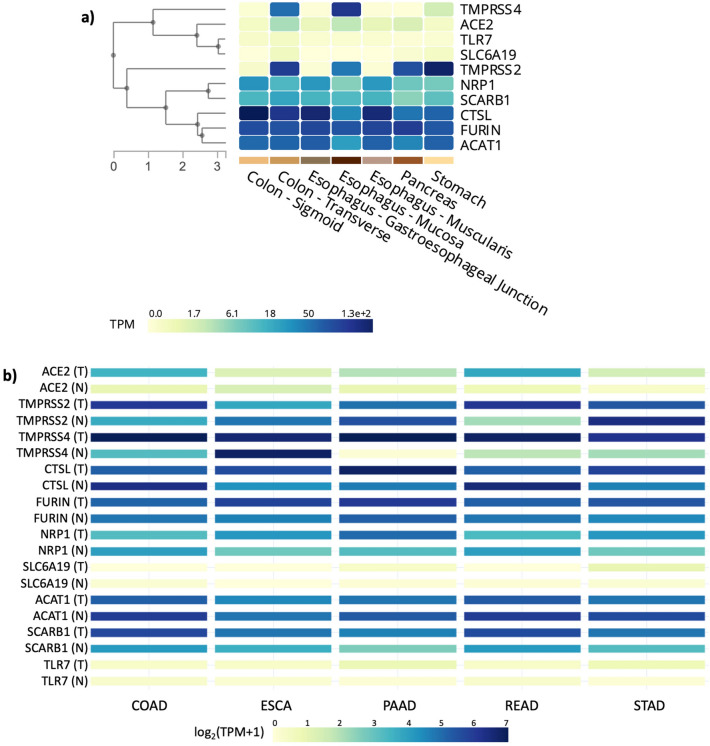
Figure 1.
Heatmap of RNA-sequencing-based gene expression from the SARS-CoV-2-associated genes generated using GTEx portal for a multi-gene query in seven gastrointestinal tissues. (a) Comparison of the genes in different gastrointestinal normal samples. (b) TCGA tumor-normal samples and GTEx samples together (T tumor, N normal, TPM Transcripts per kilobase million-expresses RNA-sequencing reads normalized for the length of gene and sequencing depth).

