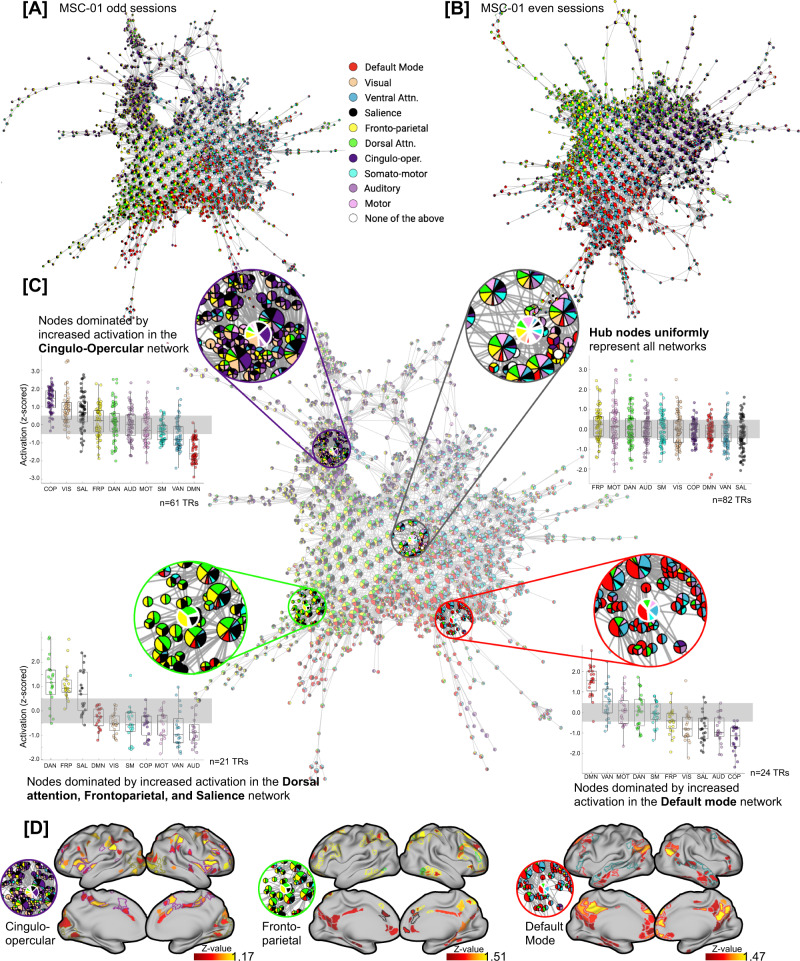
Fig. 3. Annotating Mapper-generated graphs based on individual-specific large-scale resting-state networks (RSNs).
A, B Shows Mapper-generated graph for a representative participant (MSC-01; A odd and B even sessions). Here, each node is annotated by activation in the known large-scale resting-state networks. Each node is annotated using a pie-chart to show the proportion of RSNs activated within each node. As evident, for MSC-01, for both odd and even sessions, the Mapper-generated graph has mainly three networks dominating on the periphery of the dynamical landscape: default mode, frontoparietal, and cingulo-opercular networks. C Zoomed-in view of the Mapper graph generated using MSC-01 odd sessions. The nodes with dominating RSNs are located more towards the periphery of the landscape, while the hubs of the landscape are not dominated by any RSN and rather have uniform mean-level distribution across all RSNs. Four zoomed-in circles highlight four exemplary nodes, where the peripheral nodes have one (or more) RSNs in the majority and the central node has no network dominating. Box plots represent activation (z-scored) in the corresponding RSNs across all time frames (TRs) within each highlighted node. In each boxplot, the box denotes interquartile range (IQR), the horizontal bar indicating the median, and the whiskers include points that are within 1.5 × IQR of upper and lower bounds of the IQR (25th and 75th percentiles). D Presents mean whole-brain activation maps for each of the three peripheral nodes thresholded at z = 0.5). Borders for individual specific RSNs are highlighted. As evident, whole-brain activation maps of each peripheral node clearly show higher activation in the corresponding RSNs.

