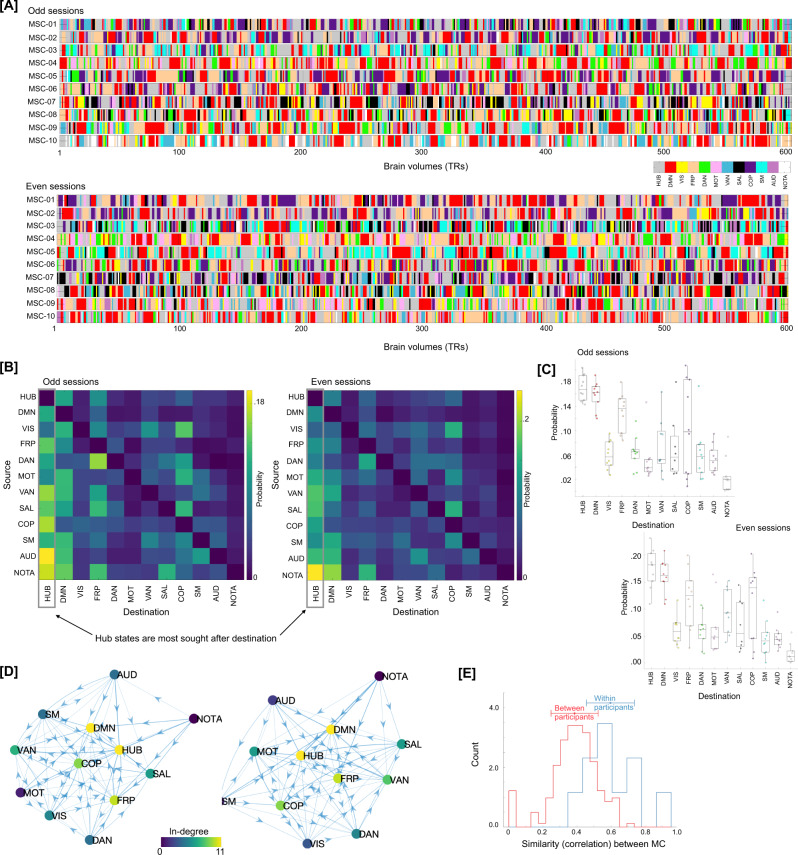
Fig. 6. Traversal in the temporal domain at the single frame level.
A Depicts transitions in brain activation over time frames in terms of dominant individual-specific RSN (or hub-like state). Each time frame (or TR) was labeled from the Mapper-generated shape-graphs by propagating the RSN-based annotation from each graph node to the time frames represented by that node. In addition to RSNs, a new label representing hub-nodes was also generated. As evident, hub state was often visited by participants across both data splits. Only showing a subset of timeframes (first 600 frames) for each participant for ease of viewing. B A discrete-time Markov chain was estimated using RSN-based labels for each participant and data split. While estimating transition probabilities, transitions due to discarding of motion affected frames and stitching sessions were rejected. Here, we present transition probability matrix averaged over all 10 MSC participants. Diagonals were suppressed to better illustrate transition probabilities across states. The hub state was observed to be the most sought-after destination from any other state, followed by the default mode network. C Boxplots depicting high probability of transitioning into the hub state from any other state, across all participants (n = 10 individuals). In each boxplot, the box denotes interquartile range (IQR), the horizontal bar indicating the median, and the whiskers include points that are within 1.5 × IQR of upper and lower bounds of the IQR (25th and 75th percentiles). D Estimated Markov chain averaged across all participants. As evident, the hub-state was observed to be most central and with highest in-degree. E The transition probability matrices (as show in B) were reliably estimated at the individual participant level (i.e., high within-participant similarity), indicating a putative application in precision medicine approaches.

