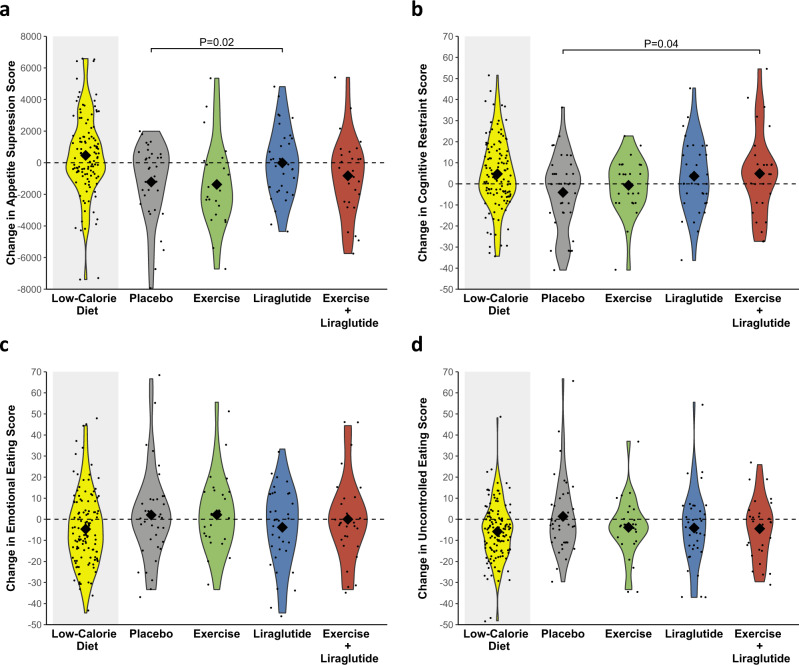
Fig. 1. Changes in postprandial appetite suppression and eating behavior during the study.
Violin plots of observed changes in a postprandial appetite suppression score, b cognitive restraint, c emotional eating, and d uncontrolled eating. Changes are from week −8 to week 0 (low-calorie diet, yellow color in grey shaded area, n = 130) for all groups combined and from week 0 to week 52 (after randomization) in the four groups, separately: placebo (grey color, n = 39), exercise (green color, n = 26), liraglutide (blue color, n = 36), and the combination of liraglutide and exercise (red color, n = 29). The diamonds indicate observed means and the dots indicate individual observations. The appetite suppression score was calculated as (satiety + fullness + [100 – hunger] + [100 – prospective food consumption])/4; all were subjective ratings (180 min area under the curve from visual analogue scales. Cognitive restraint, emotional eating, and uncontrolled eating scores were measured on a 0–100 scale by Three-Factor Eating Questionnaire-R18. Results are presented for study participants who adhered to the study interventions (per protocol population). P-values are provided for significant (P < 0.05) differences from the placebo group. P-values are two-sided and unadjusted for multiple comparisons and derived from a mixed model analysis as described in statistical analyses. Source data are provided as a Source Data file.

