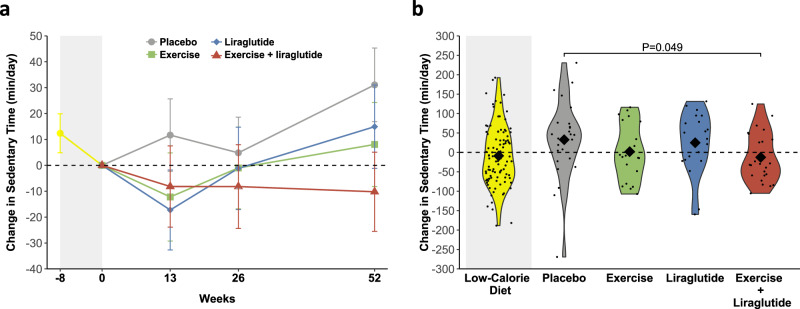
Fig. 2. Changes in sedentary time during the study.
a Mean±SEM changes in sedentary time from week −8 to week 0 (low-calorie diet, yellow color in grey shaded area, n = 130) for all groups combined and from week 0 to week 52 (after randomization) in the four groups, separately: placebo (grey color, n = 39), exercise (green color, n = 26), liraglutide (blue color, n = 36), and the combination of liraglutide and exercise (red color, n = 29). Means were estimated from a mixed model analysis as described in statistical analyses. Results are presented for study participants who adhered to the study interventions (per protocol population). Sedentary time was measured with wrist-worn accelerometry. b Violin plots of observed changes in sedentary time the low-calorie diet and for all groups, separately. The diamonds indicate observed means and the dots indicate individual observations. Results are presented for the per protocol population (n = 130). P values are provided for significant (P < 0.05) differences from the placebo group. P-values are two-sided and unadjusted for multiple comparisons and derived from a mixed model analysis as described in statistical analyses. Source data are provided as a Source Data file.

