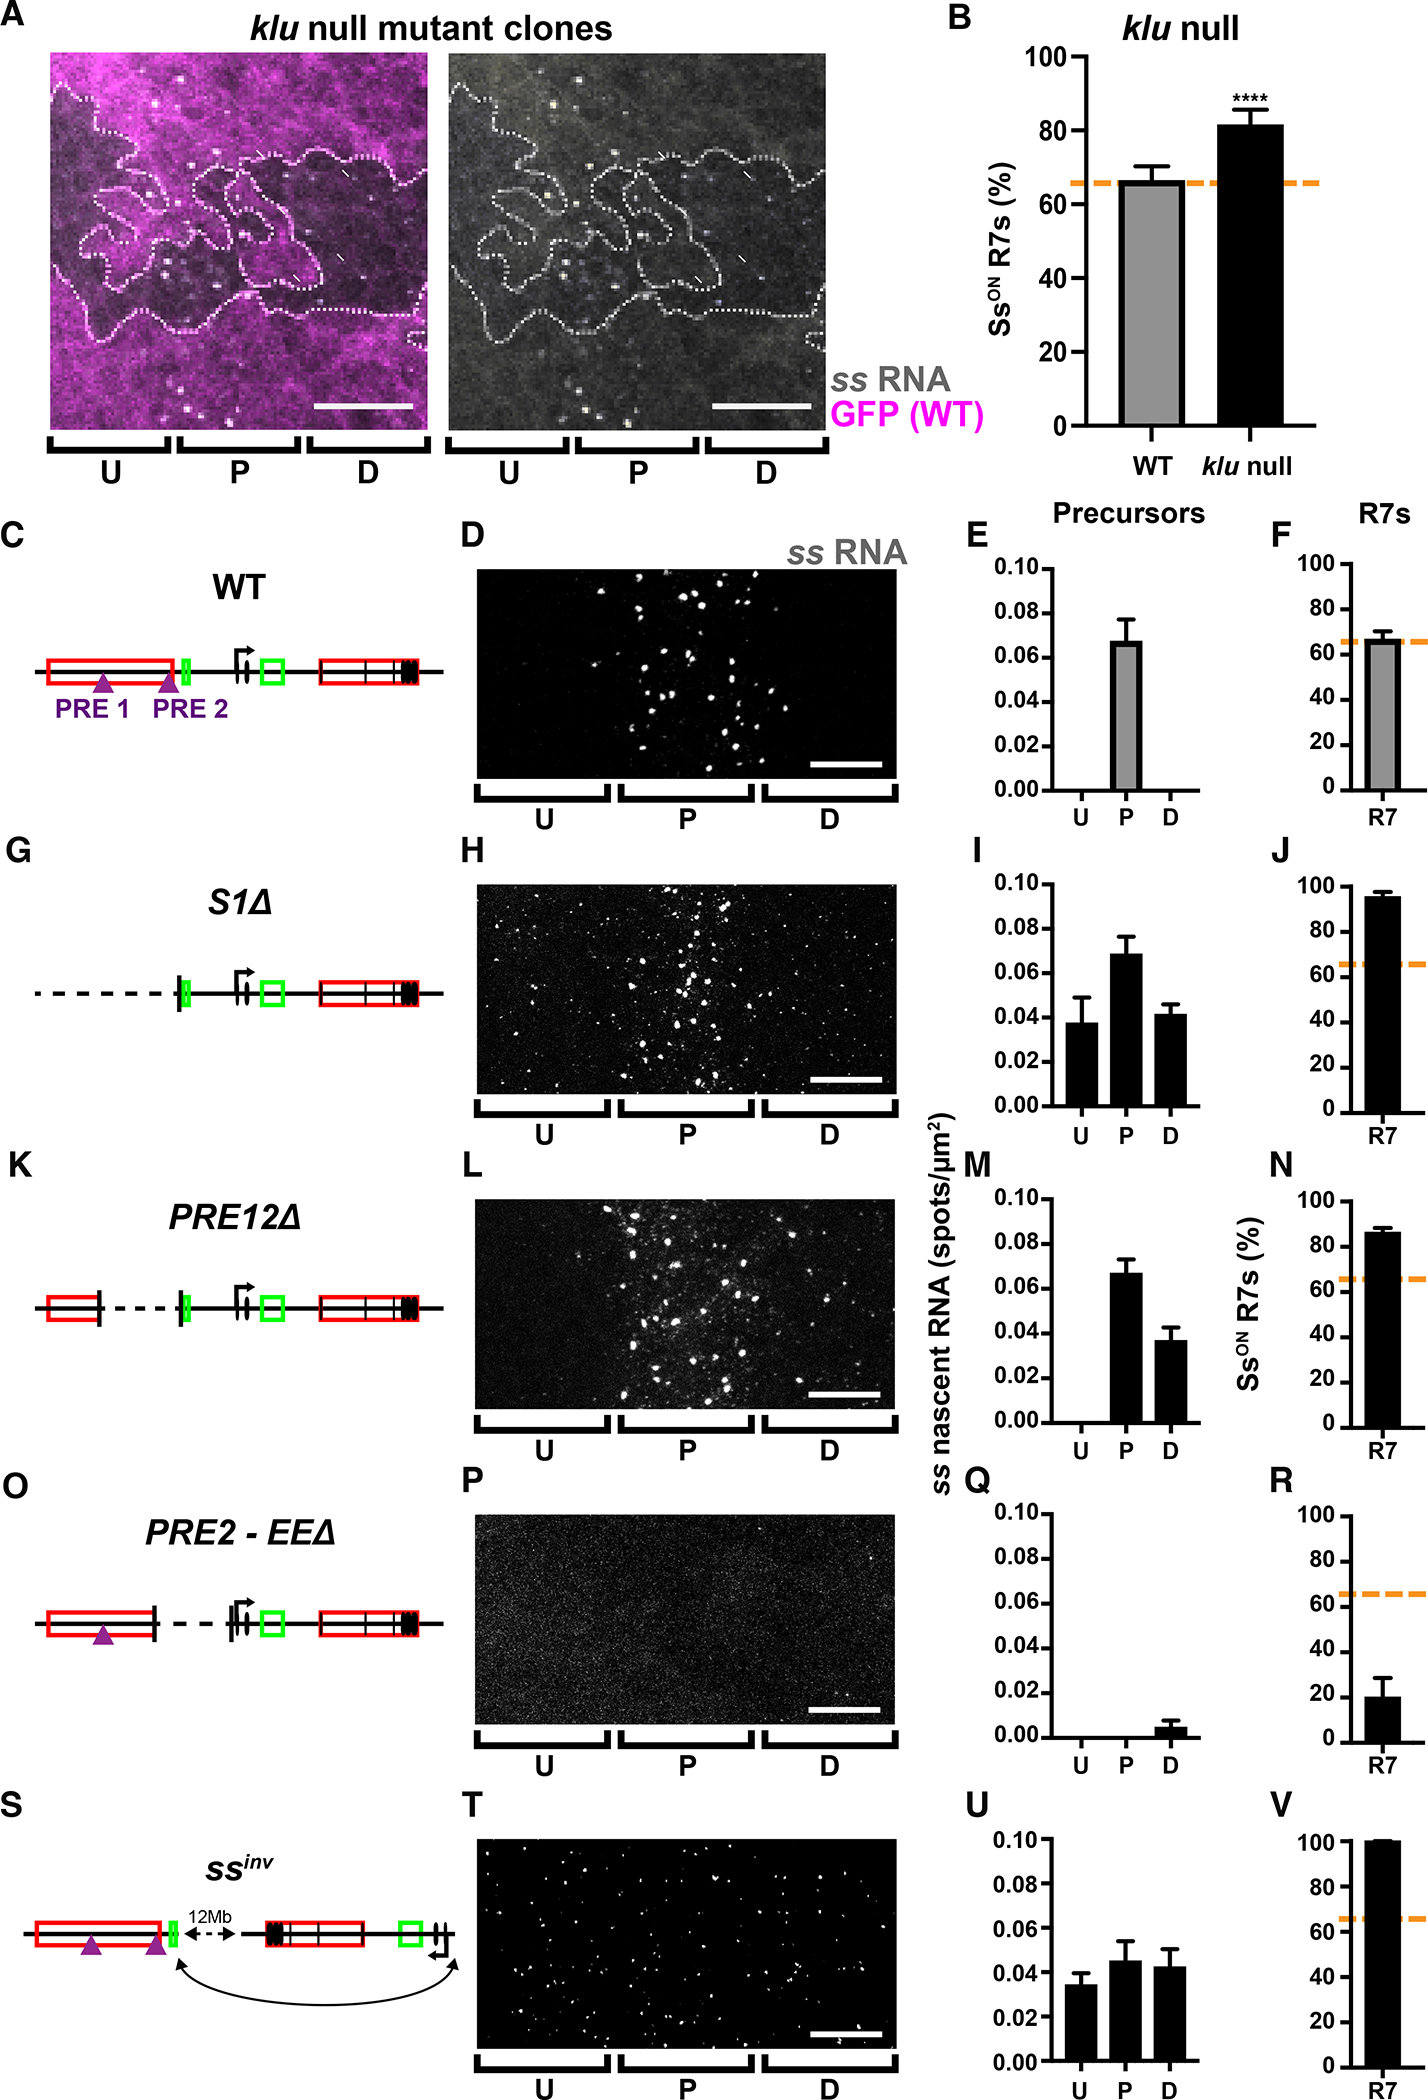
Figure 4. Derepressing early ss expression increases % SsON R7s.

For A-V) U=undifferentiated cells; P=precursors; D=differentiating cells; R7=R7s.
A) ss expression in precursors is extended into differentiating cells in klu null mutant clones. GFP- = klu null mutant; GFP+ = wild type. Gray=ss RNA; magenta=GFP; dashed line=clone boundary; arrows= ss RNA in differentiating cells. Scalebar=10 μm.
For B, F, J, N, R, V) Orange line=mean WT ss expression.
B) % SsON R7s increases in klu null mutants, similar to previous studies (Anderson et al 2017). **** denotes p<0.0001. N=3.
For C, G, K, O, S) Schematized ss locus.
For D, H, L, P, T) ss RNA in undifferentiated cells, precursors, and differentiating cells. Scalebar=10 μm.
For E, I, M, Q, U) Quantification of expression for D, H, L, P, T.
For F, J, N, R, V) % SsON R7s.
C-F) WT.
G-J) S1Δ.
K-N) PRE12Δ.
O-R) PRE2-EEΔ.
S-V) ssinv.
