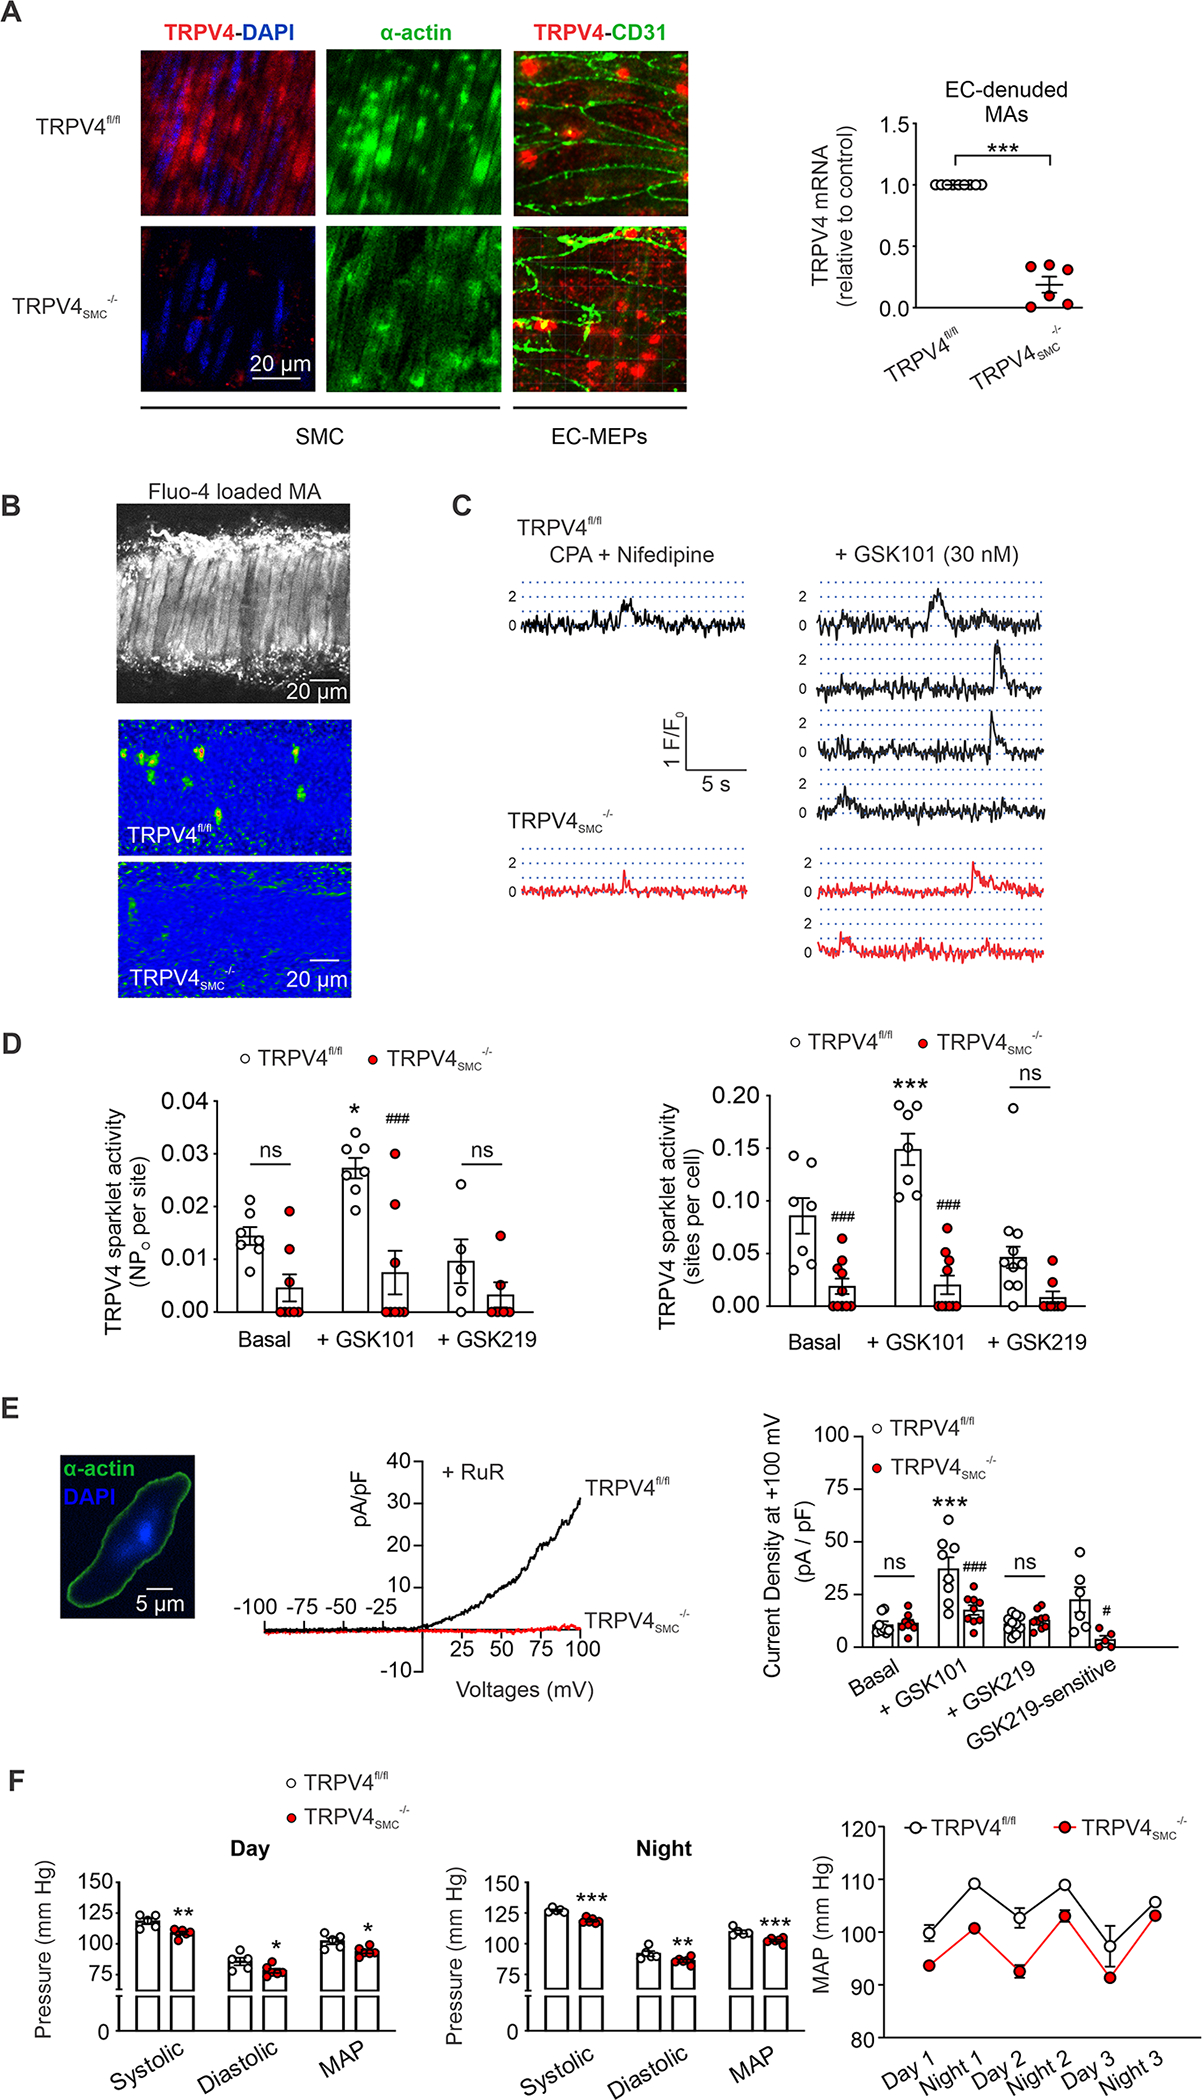
Fig. 1. Genetic deletion of SMC TRPV4 (TRPV4SMC) channels lowers resting blood pressure.

(A) Left, representative images for TRPV4 (red), α-actin (green; SMC marker), and CD31 immunostaining (green; endothelial cell marker) and nuclear staining (DAPI, blue) in en face preparations of MAs from TRPV4fl/fl and TRPV4SMC−/− mice. MEPs, myoendothelial projections. Right, TRPV4 mRNA levels in endothelium-denuded MAs of TRPV4fl/fl (n = 9) and TRPV4SMC-/- (n = 6) mice. Elementary Ca2+-influx events through TRPV4 channels (TRPV4 sparklets) were recorded in MAs loaded with Fluo-4AM (10 μM) in the presence of cyclopiazonic acid (CPA, 20 μM) to eliminate interference from Ca2+ release from the sarcoplasmic reticulum (*P < 0.05 vs. TRPV4fl/fl; unpaired t-test). (B) Grayscale image of a field of view containing ~26 SMCs from a Fluo-4AM–loaded MA (top). Pseudocolor overlay images showing all GSK1016790A (GSK101, TRPV4 agonist, 30 nM)-elicited TRPV4 sparklet events detected in a field of view in MAs from TRPV4fl/fl (middle) and TRPV4SMC-/- (bottom) mice over a 30-second interval. (C) Fluo-4AM-loaded, pressurized MAs were pretreated with CPA (20 μM), nifedipine (L-type Ca2+ channel blocker, 1 μM), and GSK101 (30 nM). Representative fractional fluorescence (F/F0) traces reflecting sparklet activity in MAs from TRPV4fl/fl and TRPV4SMC−/− mice. Dotted lines represent quantal levels (single-channel amplitudes) determined from all-points histograms. (D) Left, TRPV4 sparklet activity per site (NPo, where N is the number of channels and PO is the open state probability) and (right) TRPV4 sparklet sites per cell under basal conditions (CPA + nifedipine), with GSK101 (30 nM), or with GSK101+GSK219 (100 nM) in MAs from TRPV4fl/fl (n = 7) and TRPV4SMC−/− (n = 8) mice (*P < 0.05, ***P < 0.001 vs. CPA alone; ###P < 0.001 vs. TRPV4fl/fl; ns, not significant; two-way ANOVA). (E) Left, widefield image of an isolated SMC from a mouse MA stained for α-actin (green); blue indicates nuclear staining with DAPI. The fusiform shape (positive α-actin staining) is characteristic of isolated SMCs selected for patch-clamp experiments. Middle, representative whole-cell patch-clamp traces of GSK219-sensitive TRPV4 currents (GSK101 [30 nM] minus GSK101+GSK2193874 (GSK219; TRPV4 inhibitor; 100 nM) in freshly isolated SMCs from MAs of TRPV4fl/fl and TRPV4SMC−/− mice. Experiments were performed in the presence of ruthenium red (RuR; TRPV4 inhibitor, 1 μM) to prevent Ca2+ influx through TRPV4 channels and subsequent activation of BK currents. Right, averaged outward currents in freshly isolated SMCs from MAs of TRPV4fl/fl (n = 8) and TRPV4SMC−/− (n = 8) mice at +100 mV under basal conditions in the presence of GSK101 (30 nM) or GSK101+GSK219 (100 nM), and GSK219-sensitive currents (GSK101 minus GSK101+GSK219) (***P < 0.001 vs. Basal; ###P < 0.001 vs. TRPV4fl/fl; ns, not significant; two-way ANOVA). (F) Quantification of systolic and diastolic blood pressure, and mean arterial pressure (MAP; mean ± SEM) during (left) daytime and (middle) nighttime in TRPV4SMC−/− (n = 6) and TRPV4fl/fl (n = 5) mice. (right) Resting MAP (mean ± SEM) in TRPV4fl/fl (n = 5) and TRPV4SMC−/− (n = 6) mice recorded over 3 days and 3 nights (*P < 0.05; **P < 0.01; ***P < 0.001 vs. TRPV4fl/fl; two-way ANOVA).
