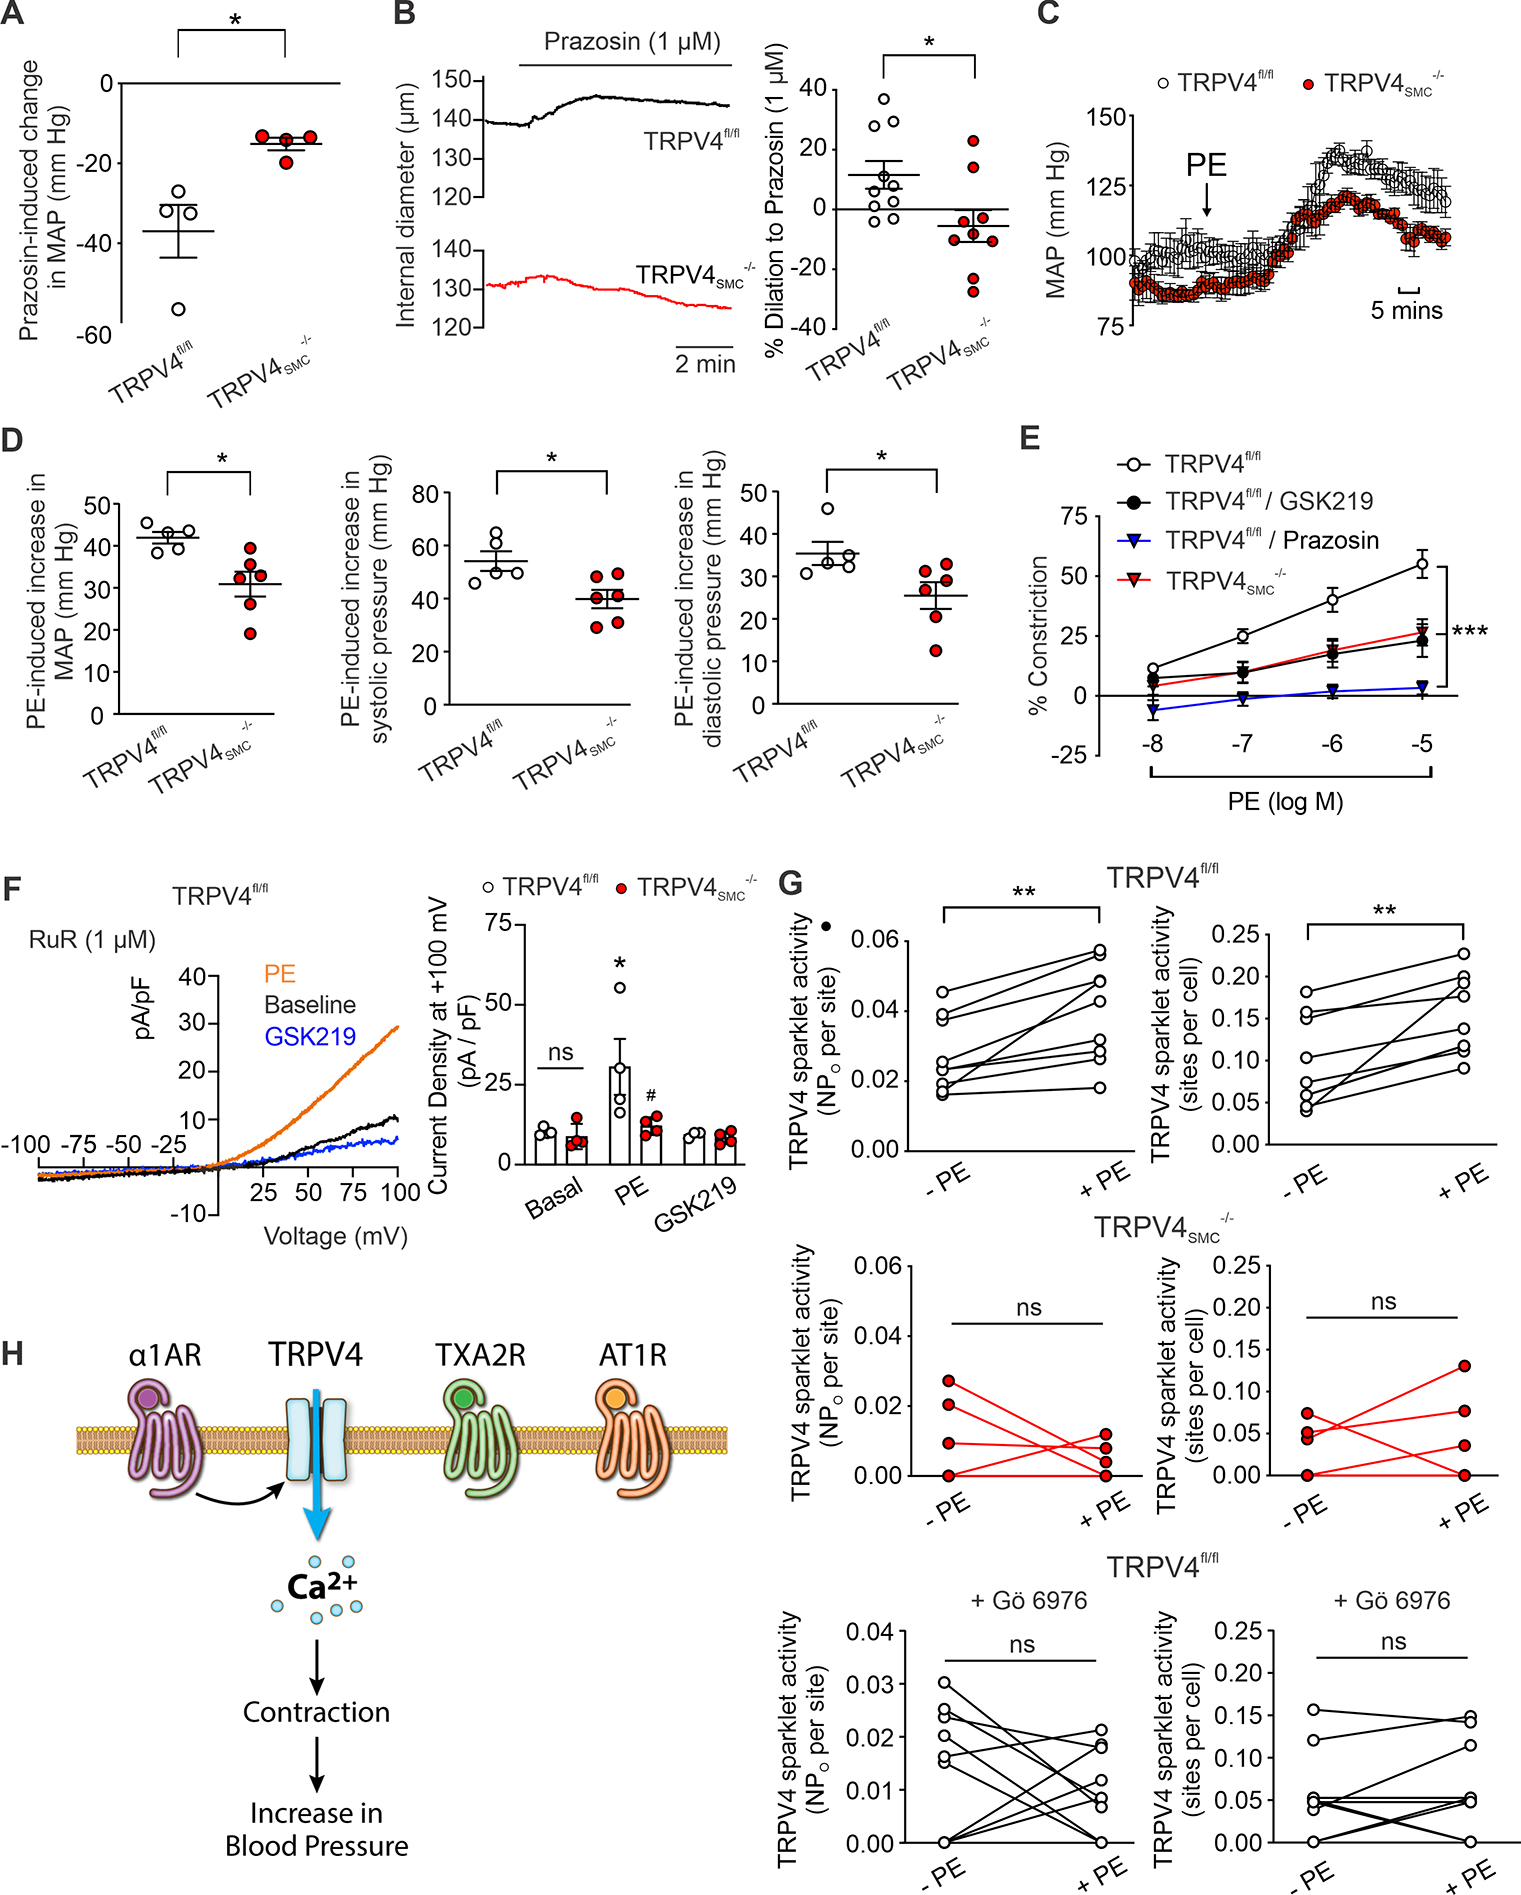
Fig. 2. α1AR signaling causes vasoconstriction and elevates blood pressure through TRPV4SMC channel activation.

(A) Decrease in resting MAP after a single bolus injection of prazosin (α1 adrenergic receptor [α1AR] blocker; 1 mg/kg; i.p.). (TRPV4fl/fl, n = 4; TRPV4SMC−/−, n = 4; *P < 0.05 vs. TRPV4fl/fl; unpaired t-test). (B) Left, representative diameter traces for prazosin (1 μM)-induced dilation in resistance MAs of TRPV4fl/fl and TRPV4SMC−/− mice. Right, percent dilation of MAs from TRPV4fl/fl (n = 10) and TRPV4SMC−/− (n = 9) mice in response to prazosin (*P < 0.05 vs. TRPV4fl/fl; unpaired t-test). (C) Mean arterial pressure (MAP) in TRPV4fl/fl (n = 5) and TRPV4SMC−/− (n = 6) mice, averaged before and after the administration of phenylephrine (PE; 10 mg/kg; i.p.). (D) Left, increase in MAP after a single bolus injection of PE. (*P < 0.05 vs. TRPV4fl/fl; unpaired t-test.) Middle, increase in systolic pressure after a single bolus injection of PE (*P < 0.05 vs. TRPV4fl/fl; unpaired t-test). Right, increase in diastolic pressure after a single bolus injection of PE (*P < 0.05 vs. TRPV4fl/fl; unpaired t-test). (E) PE-induced constriction of resistance MAs in the absence or presence of the TRPV4 inhibitor GSK219 (100 nM) or α1AR antagonist prazosin (1 μM). (TRPV4fl/fl, n = 8; TRPV4SMC−/−, n = 7; TRPV4fl/fl+GSK219, n = 5; TRPV4fl/fl+prazosin, n = 4; ***P < 0.001 vs. TRPV4fl/fl; two-way ANOVA). (F) Left, representative traces of ionic currents through TRPV4 channels in isolated SMCs from MAs of control mice at +100 mV under baseline conditions and in the presence of PE (1 μM) or GSK219 (100 nM), recorded in the whole-cell patch-clamp configuration. Experiments were performed in the presence of RuR (1 μM) to block Ca2+ entry at negative voltages. Right, averaged outward currents of isolated SMCs from MAs of TRPV4fl/fl mice (n = 4) and TRPV4SMC−/− mice (n = 4) before and after administration of PE (1 μM) or GSK219 (100 nM) at +100 mV (*P < 0.05 vs. Basal; ns, not significant; two-way ANOVA). (G) TRPV4SMC sparklets in MAs from TRPV4fl/fl and TRPV4SMC−/− mice, expressed as activity per site (top left, middle left, bottom left) and sites per cell (top right, middle right, bottom right). Fluo-4AM-loaded, pressurized MAs from TRPV4fl/fl (n = 9) and TRPV4SMC−/− (n = 6) mice were pretreated with CPA (20 μM), nifedipine (1 μM), and GSK101 (30 nM). Experiments were performed before and after adding PE, with and without Gö 6976 (PKCα/β inhibitor, 1 μM) pretreatment (**P < 0.01 vs. –PE; ns, not significant; paired t-test). (H) Schematic diagram showing that α1AR, but not thromboxane A2 (TXA2R) or angiotensin II type 1 receptors (AT1R), activates TRPV4SMC channels, causing subsequent contraction of SMCs and increasing blood pressure.
