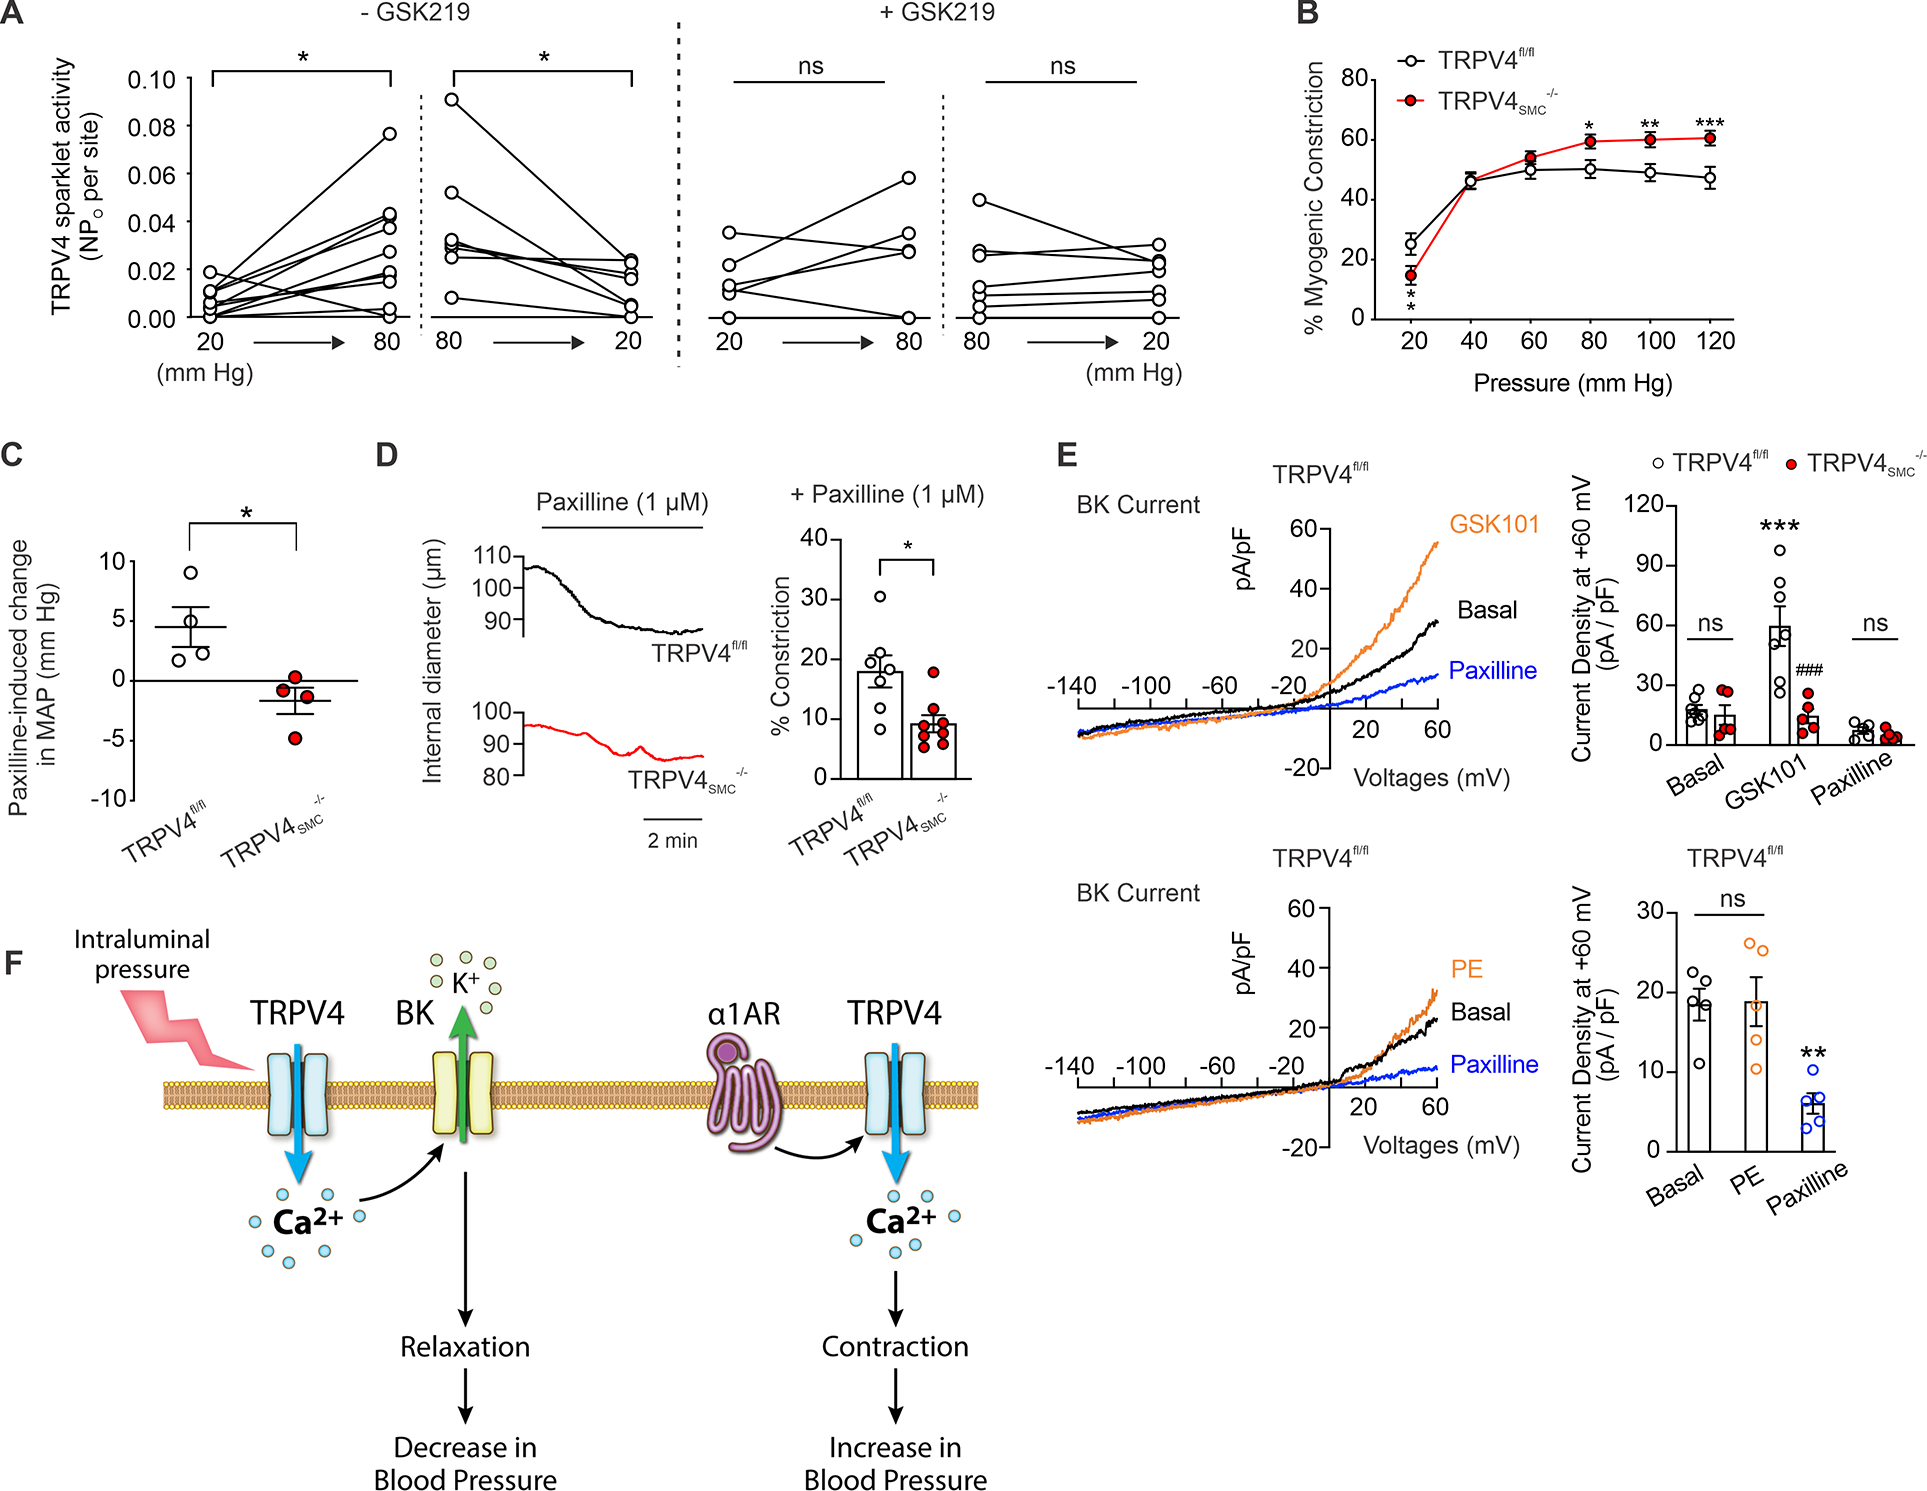
Fig. 3. Intraluminal pressure-activated TRPV4SMC–BK channel signaling opposes myogenic vasoconstriction and lowers blood pressure.

(A) TRPV4SMC sparklets (activity per site) in MAs from control mice were performed. Pressurized MAs were pretreated with CPA (20 μM), nifedipine (1 μM) and GSK101 (30 nM). Intraluminal pressure was increased from 20 mm Hg to 80 mm Hg and back to 20 mm Hg in the absence or presence of GSK219 (100 nM) in MAs from TRPV4fl/fl (n = 7) mice (*P < 0.05; ns, not significant; paired t-test). (B) Averaged data showing the development of myogenic constriction in MAs from TRPV4fl/fl (n = 8) and TRPV4SMC−/− (n = 8) mice in response to different intraluminal pressures (*P < 0.05 vs. TRPV4fl/fl, **P < 0.01 vs. TRPV4fl/fl, ***P < 0.001 vs. TRPV4fl/fl; two-way ANOVA). (C) Increase in resting MAP in TRPV4fl/fl and TRPV4SMC−/− mice (n = 4 each) after a single bolus injection of paxilline (8 mg/kg, i.p.; *P < 0.05 vs. TRPV4fl/fl; unpaired t-test). (D) Left, representative pressure myography traces of paxilline (1 μM)-induced constriction of MAs from TRPV4fl/fl and TRPV4SMC−/− mice. Right, averaged data showing the constriction to paxilline (1 μM) in MAs from TRPV4fl/fl (n = 7) and TRPV4SMC−/− (n = 8) mice (*P < 0.05 vs. TRPV4fl/fl; unpaired t-test). (E) Top left, representative traces of ionic currents through BK channels in isolated SMCs from MAs of TRPV4fl/fl mice under baseline conditions and in the presence of GSK101 (30 nM), recorded in the whole-cell patch-clamp configuration. Top right, averaged outward currents in isolated SMCs from MAs of TRPV4fl/fl mice (n = 7) and TRPV4SMC−/− mice (n = 5) at +60 mV under basal conditions and in the presence of GSK101 (30 nM) before and after addition of paxilline (BK channel inhibitor; 8 mg/kg; i.p.; *P < 0.05 vs. TRPV4fl/fl; unpaired t-test). Bottom left, representative traces of ionic currents through BK channels in isolated SMCs under baseline conditions and in the presence of PE (1 μM), recorded in the whole-cell patch-clamp configuration. Bottom right, averaged outward currents in isolated SMCs from MAs of TRPV4fl/fl mice (n = 5) at +60 mV under basal conditions and in the presence of PE (1 μM) before and after the addition of paxilline (1 μM; **P < 0.01 vs. Basal; ns, not significant; one-way ANOVA). (F) Schematic diagram showing discrete TRPV4–BK and α1AR–TRPV4SMC signaling in SMCs.
