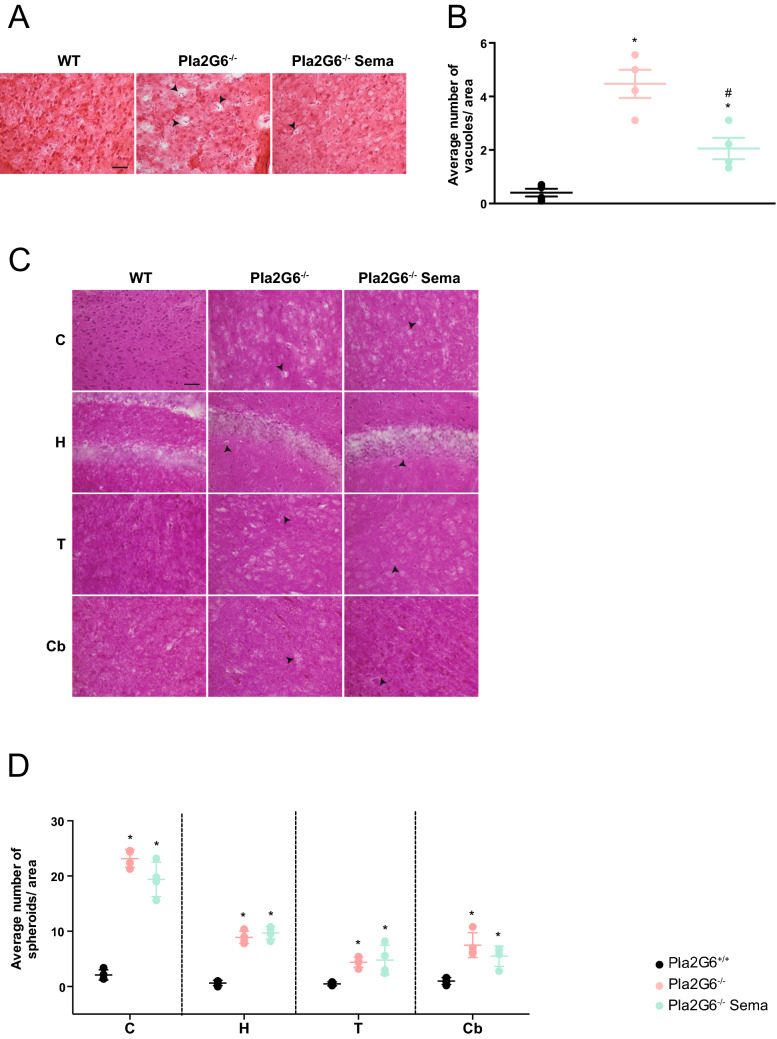
Figure 5.
Assessment of INAD disease specific markers: vacuoles and spheroids quantification in Pla2g6−/− mice. (A) Representative images and (B) vacuole quantification in Pla2g6−/− brains using H&E staining (WT n = 4, Pla2g6−/− n = 4; Pla2g6−/− Sema n = 4). Scale bar = 100 µm. (C) Representative images of different brain regions stained with periodic acid-Shiff (PAS) staining (C = cortex H = hippocampus T = thalamus Cb = cerebellum). Scale bar = 100 µm. (D) Spheroids quantification in Pla2g6−/− brains and controls (WT n = 4, Pla2g6−/− n = 4; Pla2g6−/− Sema n = 4). All data are presented as individual animals mean (SEM); ordinary one-way ANOVA adjusted using Tukey’s multiple comparisons test; p values reported in Table S8. * indicates statistically significant difference between the relevant experimental group and WT controls; # indicates statistically significant difference between Pla2g6−/− Sema mice and untreated Pla2g6−/− controls.

