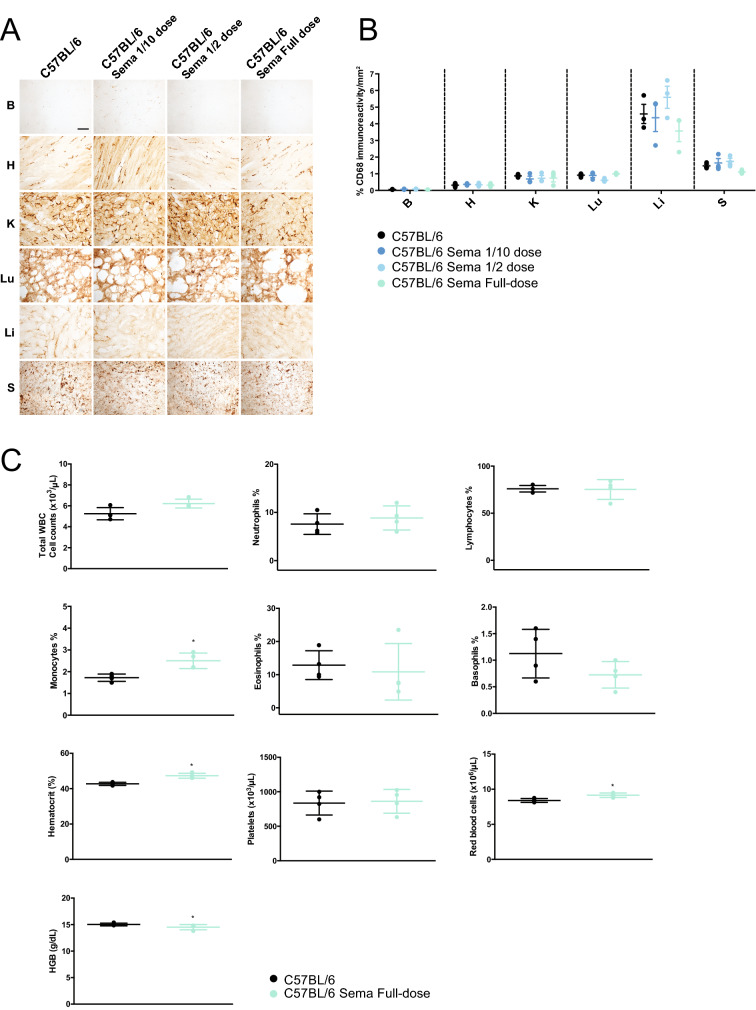
Figure 6.
Histopathological organ assessment for macrophage mediated inflammatory response and blood analysis following weekly semaglutide administration. (A) Representative images and (B) quantitative immunoreactivity threshold measurements of microglial and macrophage marker CD68 in the brain, heart, spleen, liver, lung, pancreas and kidney for the different groups (n = 4 per group) in C57BL/6 mice following semaglutide treatment (ip weekly—3 different doses : 1/10 = 0.05 µg/g, half dose = 0.25 µg/g, full-dose = 0.5 µg/g), B = brain, H = heart, K = kidney, Lu = lung, Li = liver, S = spleen. Scale bar = 100 µm. All data are presented as individual animals mean (SEM); ordinary one-way ANOVA adjusted using Dunnett’s multiple comparisons test. (C) Total white blood cell (WBC), neutrophils, lymphocytes, monocytes, eosinophils and basophils counts, haematocrit (HCT), platelets, red blood cells (RBC), haemoglobin at the end of the treatment regimen in Pla2g6+/+ mice. All data are presented as individual animals mean (SEM); Mann–Whitney U test; p values reported in Table S9. * indicates statistically significant difference between the relevant experimental group and WT controls; # indicates statistically significant difference between Pla2g6−/− Sema mice and untreated Pla2g6−/− controls.

