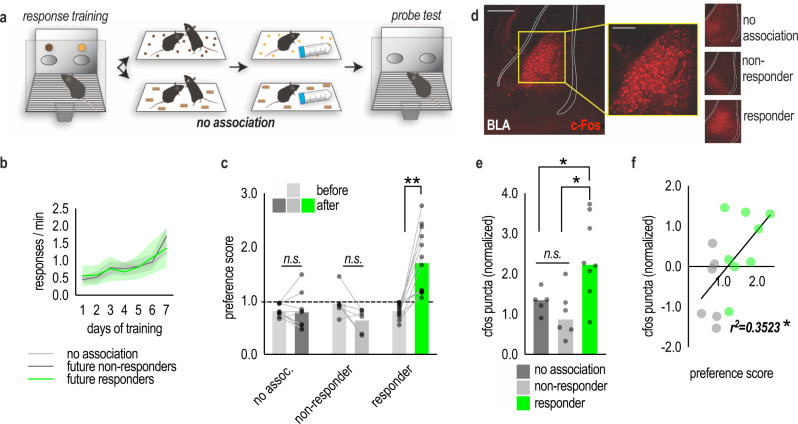
Fig. 6. C-Fos in the BLA predicts individual differences in SIFC.
a Schematic of the task. Mice were trained to nose poke for two food reinforcers. Mice were then conditioned as before (top), or, in the no association group (bottom), normal chow replaced the reinforcer pellets. Mice were returned to the operant conditioning chambers used in training, and responding to the reinforcers was quantified. b To capitalize on individual differences in SIFC, we retroactively subdivided the mice based on their performance during the probe test: those that exhibited social preference were deemed responders, and those that did not were deemed nonresponders. Mice acquired the nose poke responses. c Following the social conditioning phase, responders preferentially responded to the pellet associated with the social experience, while nonresponders and mice in the no association cohort exhibited no preference, as expected [across multiple experiments nno assoc. = 17, nnon-resp. = 7, nresp. = 13; two-way ANOVA]. d Representative images depicting c-Fos in the BLA following SIFC. Scale bar = 200 µm. e C-Fos levels were higher in responders than nonresponders or the no association group [nno assoc. = 5, nnon-resp. = 6, nresp. = 8; one-way ANOVA]. f The amount of c-Fos in the BLA predicted the amount of preference for the social pellet in SIFC [n = 14]. A dashed line indicates no preference. Bars represent means, a line represents simple linear regression, symbols represent individual mice, in (b) shaded area represents SEMs. *p < 0.05, **p < 0.001. No assoc. no association, non-resp. non-responder, resp. responder. Source data are provided as a Source Data file.

