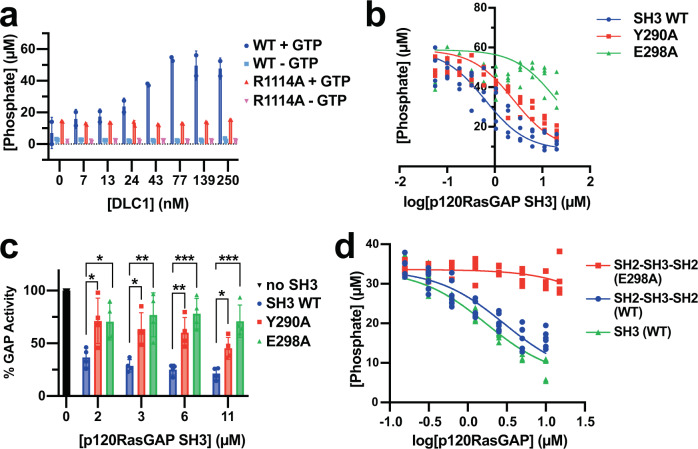
Fig. 4. Biochemical assessment of p120RasGAP SH3 domain inhibition of DLC1 RhoGAP activity.
a DLC1 RhoGAP wild-type (WT, blue and cyan) but not R1114A mutant (red and pink) stimulates RhoA GTPase activity. The concentration of phosphate generated (μM) with added GTP (+GTP) or without GTP (−GTP) is shown. Data are shown as mean values (bars) +/− SD (error bars), and individual measurements are plotted (dots, n = 2). b Titration of p120RasGAP SH3 domain (0–20 μM) wild type (WT, blue) and structurally defined mutants Y290A (red) and E298A (green) to inhibit DLC1 RhoGAP activity. The phosphate generated (in μM) is plotted against the log10 of SH3 concentration (μM), IC50 values were calculated by nonlinear regression (lines), and individual measurements are plotted (dots, n = 4). c Representative SH3 domain concentrations from (b) (2, 3, 6, and 10 μM). % GAP activity is normalized to the maximum phosphate generated by DLC1 stimulated RhoA (black bar, 100%). Data are mean values (bar graph) +/− SD (error bars), and individual measurements are plotted (dots, n = 4). P values: WT vs Y290A: 2 μM SH3: P = 0.0414; 3 μM SH3: P = 0.0263; 6 μM SH3: P = 0.0070; 11 μM SH3: P = 0.0346; WT vs E298A: 2 μM SH3: P = 0.0455; 3 μM SH3: P = 0.0041; 6 μM SH3: P = 0.0004; 11 μM SH3: P = 0.0004. d Inhibition of DLC1 RhoGAP activity by p120RasGAP SH2-SH3-SH2 wild type (blue) or E298A mutant (red), and SH3 domain (green). The phosphate signal (μM) is plotted against the log10 of p120RasGAP concentration. IC50 values were calculated by nonlinear regression (lines), and individual measurements are plotted (dots, n = 7). In b, d, IC50 values are calculated by nonlinear regression in GraphPad Prism using the One site–fit logIC50 model, and are reported in Table 2. In c, P values are calculated in GraphPad Prism using ordinary one-way ANOVA analysis with Tukey’s multiple comparison test. Significant differences are based on P values as indicated:* P = 0.01 to 0.05;** P = 0.001 to 0.01;*** P = 0.0001 to 0.001. Source data are available as a Source Data file.

