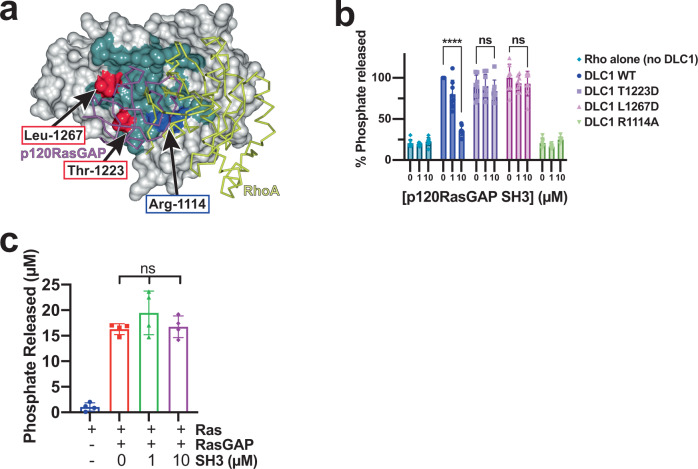
Fig. 5. DLC1 RhoGAP mutants and p120RasGAP are not inhibited by SH3 domain.
a Surface representation of DLC1 illustrating the differences in the footprint of binding by p120RasGAP SH3 domain (purple) and RhoA (yellow, predicted), with residues that bind p120RasGAP colored teal. DLC1 residues mutated in this study are labeled. b RhoGAP activity of structurally-defined DLC1 mutants T1223D and L1267D are not inhibited by p120RasGAP SH3 domain. RhoA alone (teal) or RhoA plus the arginine finger mutant DLC1 R1114A (green) are included. Signal is plotted as % phosphate generated, normalized to activity of RhoA plus wild-type DLC1 (blue, 0 μM SH3). Data are presented as mean values (bars) +/− SD (error bars), and individual measurements are plotted (dots, n = 8). P values: WT 0 μM versus 10 μM SH3, P < 0.0001; T1223D 0 μM versus 10 μM SH3, P = 0.7747; L1267D 0 μM versus 10 μM SH3, P = 0.5663. c GTP hydrolysis by Ras (blue) is stimulated by p120RasRasGAP RasGAP domain (red) but is not inhibited by 1 μM (green) or 10 μM (purple) p120RasGAP SH3 domain. Data are presented as mean values (bars) +/− SD (error bars), and individual measurements are plotted (dots, n = 4). P values are: 0 μM versus 1 μM SH3: 0.3148; 0 μM versus 10 μM SH3: 0.9944; 1 μM versus 10 μM SH3: 0.4329. In b, c P values were calculated by ordinary one-way ANOVA analysis with Tukey’s multiple comparison test in GraphPad Prism. Significant differences are based on P values as indicated: ns: P ≥ 0.05; **** P < 0.0001. Source data are available as a Source Data file.

