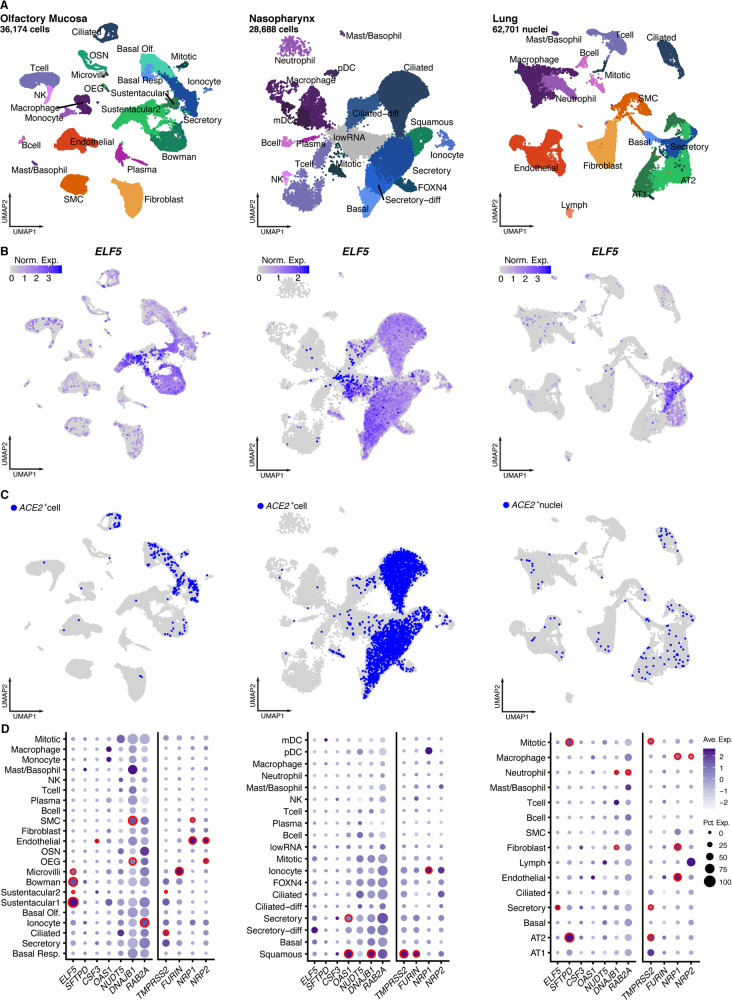
Fig. 4. Expression of candidate genes in different single-cell data sets covering the respiratory system.
A UMAP representation of single-cell/nuclei RNA sequencing data from three data sets (olfactory mucosa, nasopharynx, and lung) with annotations of cell types. B Expression levels of ELF5 across all cells identified in all three data sets. C ACE2+ cells in all three data sets. D Dot plots showing the number of cells positive for candidate genes (size). The colour gradient indicates scaled average expression levels and red frames indicate significantly higher expression (MAST-based test; false discovery rate adjusted p value < 0.05) of the target gene in one cell type compared to all others. Expression patterns for suggested host factors required for viral entry, such as TMPRSS2, FURIN, NRP1, as well as NRP2, have been added as a comparator. Data have been obtained from Lukassen et al.42, Loske et al.43, Gassen et al.41, and Durante et al.44.

