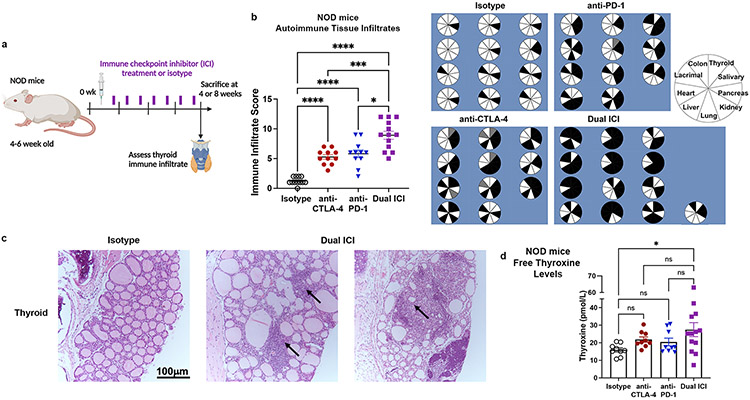
Figure 1. ICI therapy induces multi-system autoimmune infiltrates (IrAE) in NOD mice.
a, Schematic of ICI drug treatment. b, Comparison of autoimmune organ infiltration and severity by immune infiltrate score after 8 weeks of ICI treatment in NOD mice [n=12 isotype, n=11 anti-CTLA-4, n=11 anti-PD-1, and n=13 Dual ICI (anti-PD-1 + anti-CTLA-4)]. Pie charts show tissue infiltrate for each mouse; black = immune infiltrate, white = no infiltrate, gray = no data. c, Representative H&E micrographs of thyroid autoimmune tissue infiltrates in isotype (left) vs. Dual ICI (right) treated mice (original mag. 400x). Arrows indicate areas of focal infiltrates. d, Free thyroxine serum levels in ICI-treated NOD mice after 8 weeks of treatment. Data are mean±SEM. *p<0.05, ***p<0.001, ****p<0.0001, Brown-Forsythe ANOVA, assuming unequal s.d., followed by Dunnett’s multiple comparisons test (b), or one-way ANOVA and Dunnett’s multiple comparison test (d).

