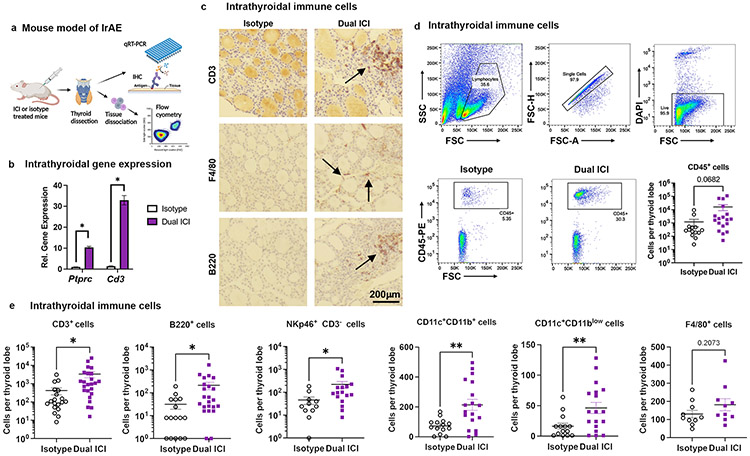
Figure 2. Characterization of thyroid-infiltrating immune cells in ICI-treated NOD mice.
a, Schematic of thyroid immune cell infiltrate evaluation in ICI-treated NOD mice. b, Comparison of intrathyroidal gene expression in isotype vs. Dual ICI-treated mice for lineage genes ptprc and Cd3e measured by qRT-PCR. n=12 animals/group; thyroid tissue pooled and run in 3 experiments, in triplicate. c, IHC staining for T cells (CD3), macrophages (F4/80), and B cells (B220) in thyroid tissue from isotype or Dual ICI-treated mice (representative sections, 400x original mag.) d-e, Comparison of thyroid immune cell infiltrate by flow cytometry. Representative gating strategies and dot plots and comparison of accumulated CD45+ immune cells (c) and subpopulations (d) in thyroid tissue from isotype (n=11, except n=16 for CD3+ and B220+) vs. Dual ICI-treated (n=17, except n=23 for CD3+ and B220+) mice after 4 weeks. Data shown as absolute cells per thyroid lobe. Data are mean±SEM. *p<0.05, **p<0.01, two-tailed, unpaired t test with Welch correction, assuming unequal s.d. and Holm-Sidak method correction for multiple comparisons (b, d-e).

