

Abstract
In Alport mice, activation of the endothelin A receptor (ETAR) in mesangial cells results in sub‐endothelial invasion of glomerular capillaries by mesangial filopodia. Filopodia deposit mesangial matrix in the glomerular basement membrane (GBM), including laminin 211 which activates NF‐κB, resulting in induction of inflammatory cytokines. Herein we show that collagen α1(III) is also deposited in the GBM. Collagen α1(III) localized to the mesangium in wild‐type mice and was found in both the mesangium and the GBM in Alport mice. We show that collagen α1(III) activates discoidin domain receptor family, member 1 (DDR1) receptors both in vitro and in vivo. To elucidate whether collagen α1(III) might cause podocyte injury, cultured murine Alport podocytes were overlaid with recombinant collagen α1(III), or not, for 24 h and RNA was analyzed by RNA sequencing (RNA‐seq). These same cells were subjected to siRNA knockdown for integrin α2 or DDR1 and the RNA was analyzed by RNA‐seq. Results were validated in vivo using RNA‐seq from RNA isolated from wild‐type and Alport mouse glomeruli. Numerous genes associated with podocyte injury were up‐ or down‐regulated in both Alport glomeruli and cultured podocytes treated with collagen α1(III), 18 of which have been associated previously with podocyte injury or glomerulonephritis. The data indicate α2β1 integrin/DDR1 co‐receptor signaling as the dominant regulatory mechanism. This may explain earlier studies where deletion of either DDR1 or α2β1 integrin in Alport mice ameliorates renal pathology. © 2022 Boys Town National Research Hospital. The Journal of Pathology published by John Wiley & Sons Ltd on behalf of The Pathological Society of Great Britain and Ireland.
Keywords: Alport syndrome, podocyte injury, collagen α1(III), integrin α2β1, discoidin domain receptor 1
Introduction
Alport syndrome, characterized by congenital onset and variably progressive (based on the specific mutation) glomerular disease associated with hearing loss, results from mutations in type IV collagen genes, COL4A3, COL4A4, and COL4A5. There are two inherited forms of the disease: autosomal recessive (involving COL4A3 or COL4A4) [1, 2], accounting for about 20% of cases, and X‐linked (involving COL4A5) [3], accounting for about 80%. Mutations in any of these three genes usually results in the absence of all three collagen chains in the glomerular basement membrane (GBM), due to an obligatory association of the three chains to form protomers. This results in a GBM that contains only a type IV collagen α1/α2 network with two distinct consequences that likely contribute to glomerular disease initiation. The first is that the type IV collagen network is thinner and contains fewer interchain crosslinks than the type IV collagen α3/α4/α5 network [4]. This imparts greater elasticity to the GBM, resulting in biomechanical stress on the cells comprising the glomerular capillary tufts. This biomechanical stress directly drives the expression of genes contributing to glomerular pathology and accelerates the progression of glomerular disease in Alport mice [5]. The second consequence, which is more theoretical in nature, is based on super‐resolution microscopic analysis of the GBM in wild‐type and Alport mice that placed the GBM collagen network in Alport mice, but not wild‐type mice, within range to interact with collagen receptors on podocytes [6].
The mechanism of biomechanical strain‐mediated glomerular pathology is more complex. Abnormal stresses on the glomerular capillary tuft result in up‐regulation of endothelin‐1 in glomerular endothelial cells that binds to endothelin A receptors (ETARs) on the glomerular mesangial cells. ETAR signaling results in activation of CDC42, which induces the migration of mesangial filopodia into the sub‐endothelial space of the glomerular capillaries [7, 8]. One consequence of the mesangial filopodial invasion is the deposition of mesangial proteins in the GBM. It was shown by our lab and others two decades ago that laminin α2 progressively accumulates in the GBM of Alport mice, dogs, and humans [9, 10]. We later showed that the presence of this laminin directly injures podocytes, activating focal adhesion kinase (FAK) with downstream activation of the transcription factor NF‐κB, which activates the expression of pro‐inflammatory mediators [11]; however, the specific receptor(s) mediating these effects was not identified in this study.
In the present study, we identified for the first time a second mesangial extracellular matrix (ECM) molecule accumulating in the GBM, collagen α1(III). The pattern of progressive accumulation of collagen α1(III) mirrored that for laminin 211, suggesting that they are both secreted by mesangial filopodia. Cultured wild‐type and Alport mouse podocytes do not have detectable mRNA for Lama2, suggesting that ectopic activation in podocytes is not a source of laminin α2 protein. Cultured Alport mouse podocytes overlaid with collagen α1(III) demonstrated a myriad of effects on gene expression that were consistent with podocyte injury. There are two known collagen receptors expressed by podocytes: integrin α2β1 and discoidin domain receptor 1 (DDR1). Alport mice lacking either receptor show attenuated glomerular disease progression, indicating a functional importance for these receptors in driving podocyte dysfunction, likely via aberrant collagen‐mediated signaling [12, 13]. Knockdown of DDR1 or integrin α2β1 in Alport mouse podocytes prior to overlay with collagen α1(III) produced transcriptome profiles with suppression of receptor knockdown‐specific pathologic genes as well as most genes for which knockdown of either receptor suppresses expression. This indicates that these receptors can signal in both distinct and overlapping ways. We validated cell culture data using RNA‐seq data produced from isolated glomeruli from autosomal Alport mice at 5 and 7 weeks of age. The results revealed several genes that have been previously shown to be associated with podocyte injury, glomerulonephritis, or chronic kidney disease (CKD); two of these genes encode proteins previously implicated in Alport renal disease progression (CTGF and ITGA2).
Materials and methods
Animals
129 Sv autosomal Alport mice (Col4a3 −/−) were developed in the Cosgrove lab [14]. All mice were on a pure 129 Sv genetic background and maintained in house. All procedures involving animals were conducted in accordance with an approved IACUC protocol at Boys Town National Research Hospital and were consistent with the NIH Guide for the Care and Use of Laboratory Animals. Dogs used by Dr Nabity (College of Veterinary Medicine and Biological Sciences, Texas A&M University, College Station, TX, USA) [15] were maintained under strict USDA‐approved conditions. Every effort was made to minimize usage as well as minimize any pain or distress. Both males and females were utilized. Animals were housed in groups in rooms with a 14/10‐h light/dark cycle, except for dogs, an inbred stain of Beagle, where only males were used, given they have X‐linked Alport syndrome.
Podocyte culture
Conditionally immortalized podocytes were derived from 6‐week‐old 129 Sv wild‐type or Alport mice carrying the immortomouse transgene as previously described [16]. The clonal cell line was characterized by verifying induced expression of podocin, α‐actinin‐4, nephrin, and von Willibrand factor (absence of expression) in differentiated cells compared with non‐differentiated cells prior to use. Cells were grown under permissive conditions (10% FCS, 10 U/ml γ‐interferon at 33 °C) and then plated on human fibronectin (356008; Corning, Bedford, MA, USA) at a density to achieve a 50% final confluency and allowed to differentiate (no γ‐interferon at 37 °C) for 10 days. We chose to culture cells on fibronectin rather than collagen I, which is typically used, because collagen I activates DDR1, which would confound our results [17]. During differentiation, podocytes were cultured in 5% fetal calf serum (FCS), reduced to 2% FCS on day 3 and 0.5% FCS on day 7. After 10 days of differentiation, siRNA transfections were performed by complexing 5 μl of Transit‐X2 transfection system (MIR6004; Mirus, Madison, WI, USA) and 1 μg of Silencer® Select Pre‐designed siRNAs (Ambion, Carlsburg, CA, USA) in 500 μl of DMEM/F‐12 medium, –FCS, −antibiotics for 20 min. Complexes were applied dropwise following the manufacturer's guidelines. Thirty‐six hours post‐transfection, soluble collagen α1(III) (NBP1‐97267; Novus, Centennial, CO, USA) was added to the culture media at a concentration of 5 μg/ml. After 24 h, cells were lysed in Trizol® Reagent (Ambion) and RNA was isolated from the aqueous phase utilizing PureLink™ RNA Micro Kits (12183; Invitrogen, Carlsbad, CA, USA). An RNA Quality Number (RQN) was determined for each sample using a Fragment Analyzer™ Automated CE System (Advanced Analytical Technologies, Inc, Ames, IA, USA). Samples with RQNs of ≥8 were processed using a TruSeq RNA Library Prep Kit v2 (Illumina, San Diego, CA, USA) and cDNA synthesis and libraries were generated utilizing a Nextera™ XT DNA Library Preparation Kit (Illumina). RNA‐seq analysis was performed using the Illumina® NextSeq™ 550 system.
Immunohistochemistry
An agrin antibody (AF550; R&D Systems, Minneapolis, MN, USA) was used at 1:200. A laminin α2 antibody (L‐0663; Sigma, St Louis, MO, USA) was used at 1:200. A collagen α1(III) antibody (NB600‐594; Novus Biologicals, Littleton, CO, USA) was used at 1:500. This antibody had been extensively qualified by the manufacturer and showed minimal cross‐reactivity with collagen types I, II, IV, V, and VI in ELISA assays. A DDR1 antibody (AF2396, R&D Systems) was used at 1:75. For dog kidney immunostaining, an anti‐collagen α1(III) antibody raised in goat (NBP1‐26547; Novus Biologicals) was used at 1:50. The anti‐laminin β2 antibody was from the Developmental Studies Hybridoma Bank and was a mouse monoclonal used at 1:25 dilution. An anti‐collagen I antibody (CL50151AP; Cedar Lane, Burlington, ON, Canada) was used at 1:200 dilution. Anti‐phospho‐DDR1 (Tyr513) (PA5‐37501; Thermo Fisher, Waltham, MA, USA) was used at 1:25. Anti‐integrin α2 (PA5‐47193; Thermo Fisher) was used at 1:25. Anti‐laminin α5 (EWL004; Kerafast, Boston, MA, USA) was used at 1:800. Nidogen 1 antibody (MAB1946; EMD Millipore, Burlington, MA, USA) was used at 1:200. Anti‐podocin (a gift from Dr Corinne Antignac, Institut National de la Santé et de la Recherche Médicale, Inserm UMR 1163, Laboratory of Inherited Kidney Diseases, Imagine Institute, Paris, France) was used at 1:100. Anti‐WT1 (SC‐15421; Santa Cruz Biotechnology, Dallas, TX, USA) was used at 1:50 dilution. Anti‐collagen V (1350‐01; Southern Biotech, Birmingham, AL, USA) was used at 1:100. All immunostaining was done on 4‐μm‐thick sections of frozen mouse tissue fixed with cold acetone. Sections were incubated with primary antibodies in 1% BSA in PBST (PBS plus 0.05% Tween‐20) overnight at 4 °C. All fluorescent secondary antibodies (Alexa Fluor, Thermo Fisher) were used at 1:500 dilution and applied in 1% BSA/PBST for 1 h at room temperature. Three washes in PBS, each 5 min, were performed after primary and secondary antibody incubations. Vectashield with DAPI was used as the mounting medium (Vector Labs, Burlingame, CA, USA) before coverslips were applied. Confocal microscopy was performed using a Zeiss (White Plains, NY, USA) LSM 710 and a Nikon (Melville, NY, USA) Eclipse Ti, and the images were processed using the software program Fiji (https://imagej.net/software/fiji/; Accessed 19 May 2022).
Structured illumination microscopy (SIM)
SIM images were captured using a Zeiss ELYRA PS.1 super‐resolution microscope.
Western blotting
Glomeruli were isolated, as previously described [8], from 7‐week‐old wild‐type and collagen α3(IV)‐null mice. Glomerular ECM proteins were enriched as previously described [18, 19]. Protein from a single mouse was fractionated in one lane of a 4–20% TGX™ acrylamide gel (Cat# 4561093; Bio‐Rad, Hercules, CA, USA). Proteins were electrotransferred onto PVDF membranes (Cat# 88518, Thermo Scientific), 30 V overnight at 4 °C. Membranes were blocked with 5% Blotting‐Grade Blocker (Cat# 1706404, Bio‐Rad) in Tris‐buffered saline containing 0.05% Tween‐20 for 1 h. Membranes were incubated with a 1:5,000 dilution of collagen α1(III) antibody (Cat# NB600‐594, Novus Biologicals) overnight at 4 °C. Blots were washed and incubated with a 1:10,000 dilution of anti‐rabbit HRP‐conjugated secondary antibody (Cat# 12‐348, Sigma). Blots were then developed with Radiance Chemiluminescent HRP Substrate (Cat# AC2100; Azure Biosystems, Dublin, CA, USA) according to the manufacturer's recommendation. Exposures were generated using the Azure Biosystems 600 Imaging System. Blots were stained with TotalStain Q (Cat# AC2225, Azure Biosystems) following the manufacturer's protocols. Quantification of bands was performed using the Fiji software suite. Normalization to total protein and removal of background were performed using the mean gray value for all exposures. Statistical analyses used Student's t‐test.
Collagen α1(III) mediated activation of DDR1 in cultured podocytes
Podocytes were differentiated on human fibronectin (356008, Corning)‐coated cytology slides (VWR, Batavia, IL, USA) for 10 days and treated with collagen α1(III) (NBP1‐97267, Novus) for 24 h. Slides were rinsed 5 times with PBS, fixed with −20 °C acetone for 5 min, and dried for 2 h at 25 °C. Slides were incubated with antibodies to DDR1 and pDDR1 as described above. Images were captured on a Zeiss AX10 imager, A1.
RNA‐seq analysis for podocytes and glomeruli
All experiments were performed in triplicate. Samples were processed by the Illumina NextSeq 550 platform at the University of Nebraska Medical Center's Sequencing Core Facility. The resulting Fastq files were sent through a pipeline utilizing the Trimmomatic suite [20] and a 2‐Pass STAR protocol [21] equipping the GRCm38 genome (mm10) from the National Center for Biotechnological Information (NCBI) and a curated genomic regions file. The genomic regions file was trimmed of pseudogenes, RIKEN cDNA clones, and other novel regions to clarify the resulting output.
The aligned binary files were processed using the default settings of the featureCounts program of the Rsubread package from Bioconductor, allowing multi‐overlap [22]. The resulting gene feature count values were derived using the list of curated genomic regions that are synonymous with the Mouse Genome Index (MGI) and the NCBI, filtering the same genomic regions file used for alignment. These genes had descriptions within the MGI and were also present in the NCBI database. The resulting 19,743 genomic features were used to score the alignments in featureCounts. Samples were normalized across the experiment to genes Gapdh, Atp5pb, and Pgk1 [23]. Normalized read counts were then analyzed with the Gene Set Enrichment Analysis (GSEA) Software Package v4.1.0 from the Broad Institute [24] using the Signal2Noise metric to identify differentially expressed genes and gene sets from those which are provided in the c5.all.v7.0 subset in the GSEA Molecular Signatures Database. We chose the Signal2Noise metric to discover genes with no expression to be included in the analysis that may have been excluded via the classic fold‐change metric. Genes were ranked from most induced (relative to untreated cells) to most suppressed. Those genes whose ranking metric score modulated from ±2 to 5 were cross‐referenced with data from the DDR1 and integrin α2 knockdown cells to look for return of wild‐type gene expression. These data were then validated for relevance using RNA‐seq data from 2‐ and 5‐week Alport glomeruli (three individual samples run in triplicate and analyzed as per above) to confirm induction or suppression of gene expression in vivo. It is these data that are presented in Table 1. GSEA pathway analysis was also performed for collagen α1(III)‐treated cells versus untreated control, and 7‐week‐old Col4a3 −/− mice versus wild‐type control. All pathways listed in supplementary material, Table S2, showed statistics that had nominal P value < 0.05, false discovery rate (FDR) < 0.25, and family‐wise error rate (FWER) < 0.25. Using the top 100 pathways from collagen α1(III)‐treated cells versus non‐treated, 5‐week Alport versus WT glomeruli, and 7‐week Alport versus WT glomeruli, we found the pathways in these lists that are duplicated in either the 5‐week or the 7‐week data set, listed in supplementary material, Table S3.
Table 1.
Collagen III responsive genes in cell cultures validated by glomerular RNA‐seq from 7‐week‐old WT and Alport mice
| Gene | Role in podocyte injury or protection | Reference | FC | DDR1 KD | ITGA2 KD |
|---|---|---|---|---|---|
| Tnfsf15 | Associated with nephrotic syndrome | [25] | 3.8 | 2.2 | 2.2 |
| Egfl7 | Reduces vascular elasticity increasing biomechanical strain | [26] | 3.7 | 1.3 | 1.6 |
| Fgf1 | Suppresses oxidative stress and inflammation | [27] | 3.1 | 2.0 | −1.2 |
| Itga2 | Promotes progression of CKD in Alport syndrome | [13] | 3.0 | −4.4 | −7.5 |
| Ccn2 | Encodes CTGF, associated with glomerulonephritis/inflammation | [28] | 2.7 | 2.0 | 1.9 |
| Mcub | Mitochondrial calcium uptake mediator | [29] | 2.7 | 1.7 | 2.8 |
| Nyap | PI3K Akt Rac1 cell signaling regulator/acting remodeling | [30] | 2.7 | 1.1 | 1.3 |
| Tlr5 | Toll‐like receptor shown to induce podocyte apoptosis | [31] | 2.7 | 2.1 | 1.7 |
| Itgb3 | αvβ3 heterodimer has been shown to promote podocyte injury | [32] | 2.4 | 1.4 | 2.1 |
| Tle6 | Regulates podocyte proliferation | [33] | 2.4 | 1.8 | 1.9 |
| Ntrk2 | Susceptibility gene for childhood IgA nephropathy | [34] | −2.3 | −2.0 | −4.2 |
| Cacna1b | Its deletion ameliorates diabetic nephropathy | [35] | −2.5 | −4.5 | −4.8 |
| Apela | Regulates renal fluid homeostasis | [36] | −2.7 | −1.0 | −1.2 |
| Iqgap2 | Required for the glomerular filtration barrier | [37] | −2.8 | −2.4 | −3.7 |
| Cyp2s1 | Associated with CKD in mice and humans | [38] | −3.1 | −4.2 | −2.8 |
| Kcnma1 | Associated with TRPC6‐mediated podocyte injury | [39] | −3.9 | −3.7 | −6.6 |
| Lrp3 | Associated with the formation of inflammasomes in podocytes | [40] | −6.4 | −1.1 | −2.0 |
| Steap4 | Associated with the progression of diabetic nephropathy | [41] | −16.1 | −10.3 | −7.9 |
FC, fold‐change; KD, knockdown.
KD values in bold trend towards baseline.
Glomerular isolation was performed as described previously [8]. The complete data set for RNA‐seq results for both cell cultures and glomeruli are provided in the NCBI database (https://www.ncbi.nlm.nih.gov/bioproject/PRJNA690102; Accessed 3 November 2021).
Statistical analysis
Quantitative PCR (qPCR) and RNA‐seq results were statistically analyzed using two‐tailed Student's t‐tests with Bonferroni correction.
Results
Previous work showed that DDR1 co‐localized with nephrin, positioning it at the interface between the podocyte pedicles and the GBM [42]. In Figure 1A, we show that the nephrin binding protein podocin also co‐localizes with DDR1 (as expected). Using super‐resolution structured illumination microscopy (SR‐SIM), we showed that collagen α1(III) is localized immediately adjacent to DDR1, positioning collagen α1(III) in the GBM of Alport mice. Collagen α1(III) is restricted to the mesangium in wild‐type mice (supplementary material, Figure S1) and co‐localizes with the GBM in 7‐week‐old Alport mice (supplementary material, Figure S2). It was noted from RNA‐seq data that Col3a1 mRNA was markedly induced (>10‐fold) in Alport mouse glomeruli relative to wild‐type (Figure 1C). Immunostaining intensity for collagen α1(III) in Alport glomeruli was also significantly elevated relative to wild‐type, as quantified using ImageJ software (Figure 1D; six independent glomerular images measured for each, shown in supplementary material, Figure S1). The induction of collagen α1(III) at the protein level was further confirmed using western blot analysis of extracts from isolated glomeruli from wild‐type and Alport mice (duplicate blots from two groups of wild‐type and Alport mice shown in Figure 1E; quantification and statistical analysis using Student's t‐test from three independent animals per group shown in Figure 1F). We also observed GBM staining for collagen α1(III) in Alport dog glomeruli, where it co‐localizes with laminin β2 (supplementary material, Figure S3).
Figure 1.
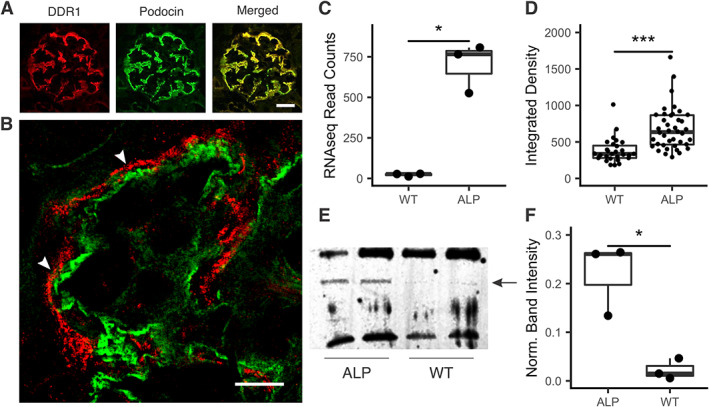
Collagen α1(III) is expressed in the glomerular basement membrane in Alport mice. (A) Dual immunofluorescence analysis was performed on kidney cryosections from 7‐week‐old wild‐type and Alport mice using antibodies for podocin (a slit diaphragm protein) and DDR1 (a collagen receptor). Clear co‐localization is apparent, placing DDR1 at the foot processes (bar = 15 μm). (B) Super‐resolution structured illumination microscopy (SR‐SIM) of dual immunofluorescence staining of a capillary loop from a 7‐week‐old Alport mouse stained with anti‐DDR1 antibodies (in red) and anti‐collagen α1(III) antibodies (in green). The adjacent localization (arrowheads) indicates basement membrane localization of collagen α1(III) (bar = 5 μm). (C) RNA‐seq results from wild‐type and Alport glomeruli show a marked (>20‐fold) increase in the expression of Col3a1 mRNA relative to wild‐type. These results were confirmed using real‐time RT‐PCR (data not shown) and microarray analysis [8]. (D) ImageJ analysis of the relative fluorescence for immunostains of wild‐type and Alport glomeruli (six independent glomeruli each) shows significant increases of fluorescence intensity in Alport mice. (E) Western blotting shows clear increases in the 139 kDa band corresponding to collagen α1(III). (F) Quantification of the relative band intensity for triplicate blots of wild‐type and Alport mouse glomeruli indicates significantly elevated abundance of collagen α1(III) in Alport glomeruli relative to wild‐type, consistent with the RNA‐seq findings. *p < 0.05, ***p < 0.001.
Dual immunofluorescence analysis for collagen α1(III) and integrin α8, a marker for mesangial cells, shows extensive invasion of mesangial filopodia into the sub‐endothelial spaces of mesangial capillaries in regions where GBM deposition of collagen α1(III) is observed (Figure 2A). Dual staining for collagen α1(III) and laminin α2 (which have previously been shown to be deposited in the GBM) [9, 11] showed that the mesangial‐derived proteins demonstrate overlapping immunostaining in the GBM, as would be expected if they were both deposited by mesangial filopodia (Figure 2B).
Figure 2.
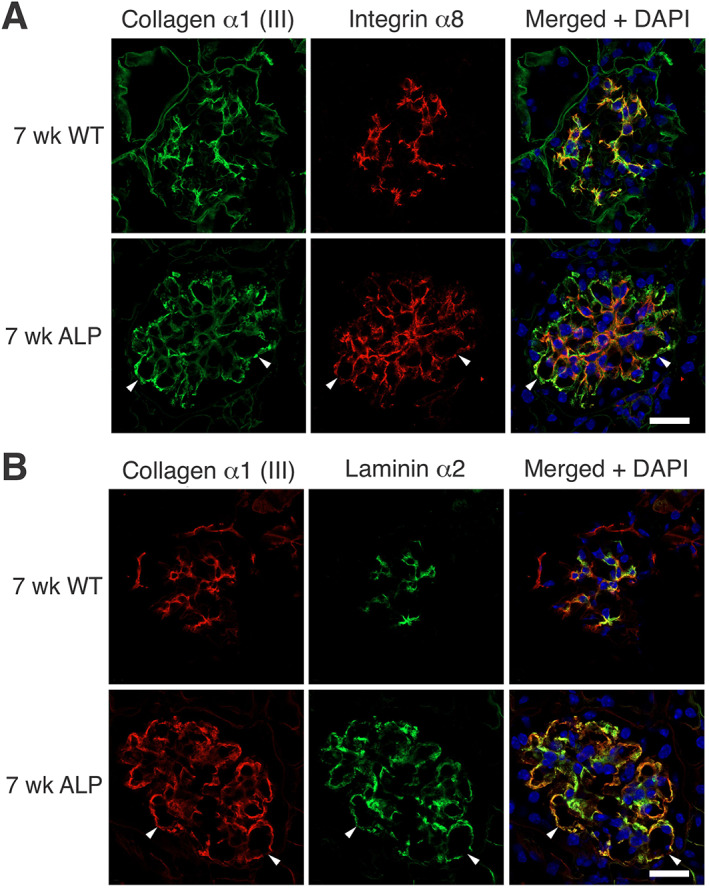
Collagen α1(III) co‐localization with glomerular mesangial matrix proteins. (A) Mesangial filopodia are evident in the areas of the GBM where collagen III is observed. Dual immunofluorescence analysis was performed on kidney cryosections from 7‐week‐old wild‐type and Alport mice using antibodies for integrin α8 (a mesangial integrin) and collagen III. Integrin α8 localizes to capillary loops where collagen α1(III) is present, consistent with a mesangial ECM protein. The dual fluorescence localizes collagen α1(III) to the GBM. Arrowheads denote areas in the GBM with clear co‐localization. Bar = 15 μm. (B) Laminin α2 and collagen α1(III) co‐localize in the GBM, consistent with their being secreted by mesangial filopodia. Dual immunofluorescence analysis was performed on kidney cryosections from 7‐week‐old wild‐type and Alport mice using antibodies for laminin α2 and collagen α1(III). Arrowheads denote areas in the GBM with clear co‐localization. Bar = 15 μm.
There are two collagen receptors expressed on glomerular podocytes: integrin α2β1 and DDR1. Deletion of either of these two receptors in Alport mice results in attenuated progression of renal disease and extended lifespan. This clearly implicates collagen‐mediated signaling via these receptors in the pathobiologic mechanism of Alport glomerular disease in the model [12, 13]. If DDR1 and integrin α2β1 receptors are to engage collagen ligands in the GBM, they must localize to the interface between the GBM and the podocyte foot processes. To determine if this is the case, we performed dual immunofluorescence analysis with antibodies to podocin and DDR1 (Figure 1A) or antibodies to integrin α2 and laminin α5 (Figure 3). Different marker antibodies were used due to compatibility with test antibodies. The results confirm proper localization of both DDR1 and integrin α2β1 for interaction with collagen ligand in the GBM. Further, the results show elevated expression of α2β1 integrin in Alport glomeruli relative to wild‐type glomeruli (Figure 3A), which was confirmed at the mRNA level (Figure 3B) and at the protein level by ImageJ analysis of replicate images (Figure 3C, six each for wild‐type and Alport).
Figure 3.
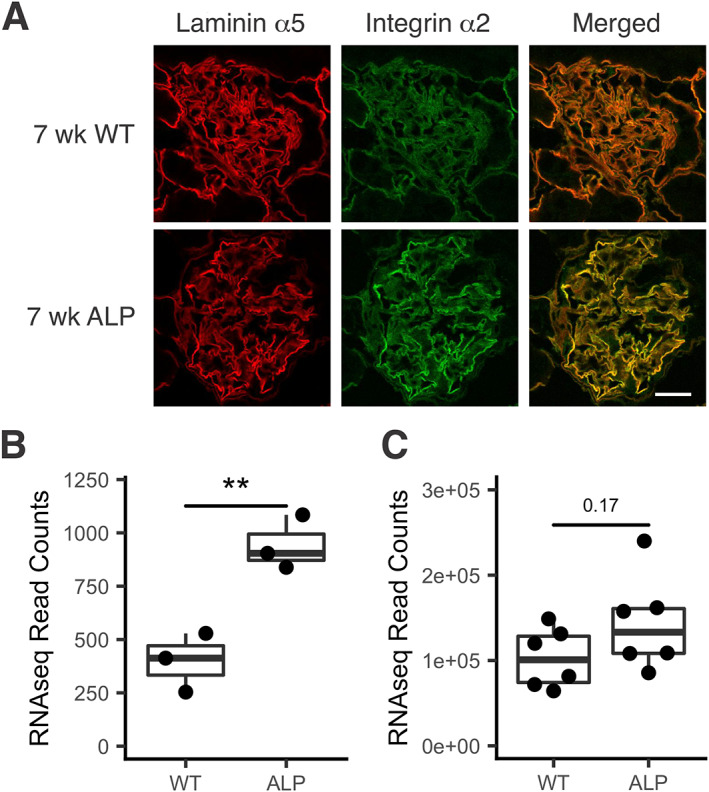
Integrin α2 co‐localizes with laminin α5 and is induced in Alport glomeruli relative to wild‐type. (A) Kidney cryosections from wild‐type and Alport mice were dual immunostained with antibodies specific for integrin α2 and laminin α5. Immunostaining indicates co‐localization with elevated levels of integrin α2 in Alport mice relative to wild‐type. Bar = 15 μm. (B) RNA‐seq of triplicate RNA samples from wild‐type and Alport glomeruli shows a significant increase of Itga2 in Alport glomeruli relative to wild‐type **p < 0.01. (C) ImageJ analysis of the relative fluorescence for immunostains of wild‐type and Alport glomeruli (six independent glomeruli each) shows an increase in Alport fluorescence intensity that trends towards significance.
For collagen α1(III) to modulate gene expression in the nucleus, it must activate receptors on podocytes. To determine whether this is the case, we overlaid cultured differentiated podocytes with collagen α1(III). DDR1 activation is easy to visualize, as it results in its translocation to the nucleus of podocytes [32]. After 24 h treatment, DDR1 was clearly localized to the nucleus in the collagen α1(III)‐treated cells, but not untreated cells (Figure 4A). As shown in Figure 1B, the GBM of 7‐week‐old Alport mice contained a significant amount of collagen α1(III), while that of wild‐type mice did not (supplementary material, Figure S1). We expected to see activated pDDR1 in Alport podocytes but not in wild‐type podocytes, and Figure 4B shows that this is indeed what we observed, with some, but indeed not all, of the pDDR1 staining localizing to the podocyte nucleus, where it co‐localizes with WT1. Super‐resolution microscopy studies suggested that the type IV collagen α3/α4/α5 network is too distant from the podocyte pedicles to interact with collagen receptors [6]. There is no direct evidence that this in fact occurs, or that the collagen IV network activates collagen receptors on podocytes. Figure 5 shows that DDR1 is not activated in glomeruli from 5‐week‐old integrin α1‐null Alport mice [a stage where collagen α1(III) is not yet significantly observed in the GBM]; thus, the type IV collagen network is likely too distant from the receptors to bind and activate them.
Figure 4.
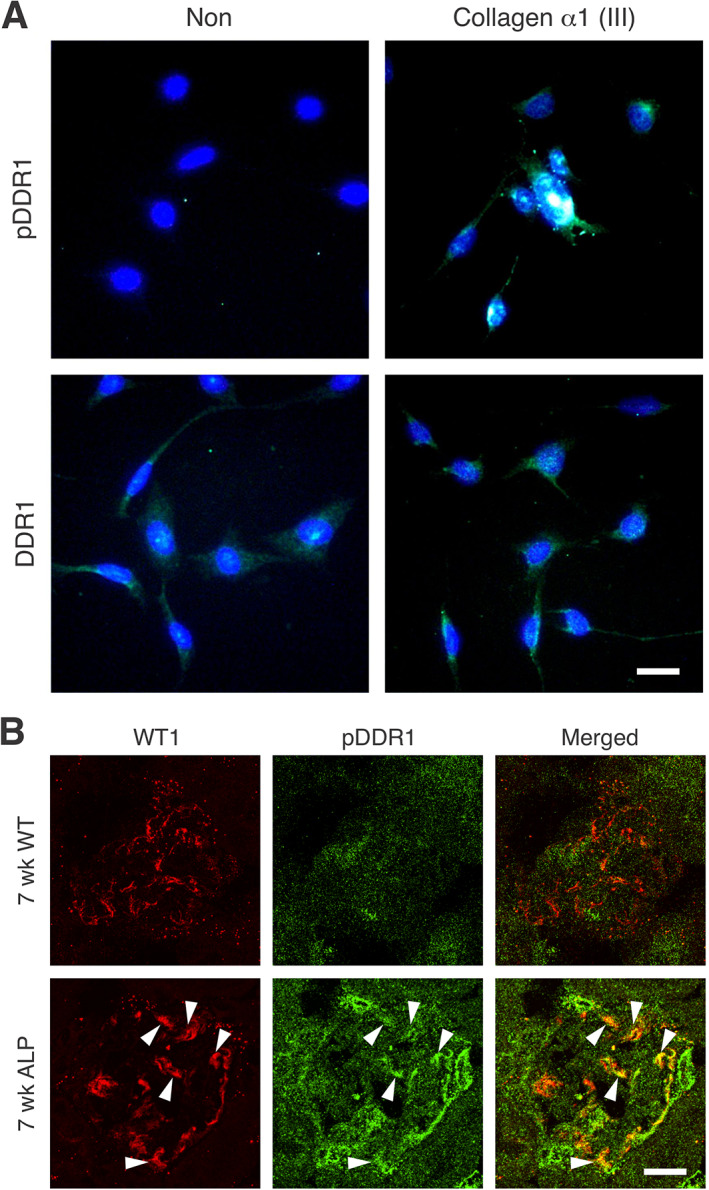
Collagen α1(III) activates DDR1 receptors both in vitro and in vivo. (A) Cells were treated or not with collagen III and after 12 h, stained with antibodies against either total DDR1 or phospho‐DDR1 (pDDR1) (bar = 5 μm). (B) Cryosections from 7‐week‐old wild‐type and Alport mice were dual immunostained with antibodies specific for pDDR1 or WT1 (a podocyte nuclear marker) (bar = 15 μm). Results indicate that collagen III activates DDR1 receptors both in vitro and in vivo in glomerular podocytes. Arrowheads denote areas of WT1 and pDDR1 co‐localization.
Figure 5.
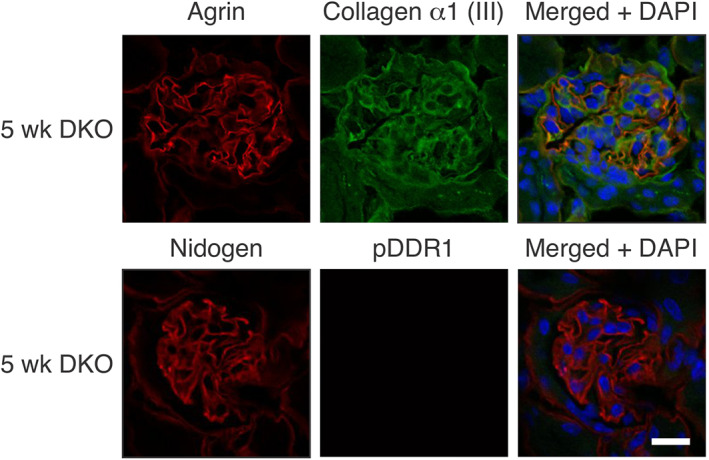
The collagen IV α1/α2 network in Alport GBM does not activate DDR1. Cryosections from 5‐week‐old integrin α1‐null Alport mice were stained with antibodies for the indicated proteins. Note the absence of collagen α1(III) in the GBM and the absence of pDDR1 nuclear immunostaining in the podocytes. This indicates that the collagen IV α1/α2 network does not activate DDR1. Bar = 15 μm.
To determine whether collagen α1(III) directly injures podocytes, we utilized cultures of Alport mouse podocytes. Alport podocytes were developed because we assumed that they would be under endoplasmic reticulum (ER) stress due to the inability to form collagen α3/4/5 (IV) heterotrimers, resulting in the accumulation of type IV collagen α4 and α5 chains in the ER. In Figure 6, we show that these cells are indeed under ER stress, based on significantly elevated expression of four ER stress‐associated transcripts relative to wild‐type podocytes [43, 44, 45, 46]. It is likely that because of ER stress, Alport podocytes may respond differently to mesangial ECM proteins than wild‐type podocytes. Podocytes were transfected with scrambled siRNA or siRNA knockdown for either integrin α2 or DDR1. In all cases, more than 80% knockdown of transcripts was achieved based on real‐time RT‐PCR analysis (supplementary material, Figure S4). After differentiating for 8 days, transfections were performed and the podocytes were overlaid with recombinant collagen α1(III) from Novus [or not overlaid with collagen α1(III), as a control] and cultured for 24 h. RNA was isolated and analyzed by RNA‐seq. The experiment was performed three independent times and each sample analyzed independently to allow statistical analysis.
Figure 6.
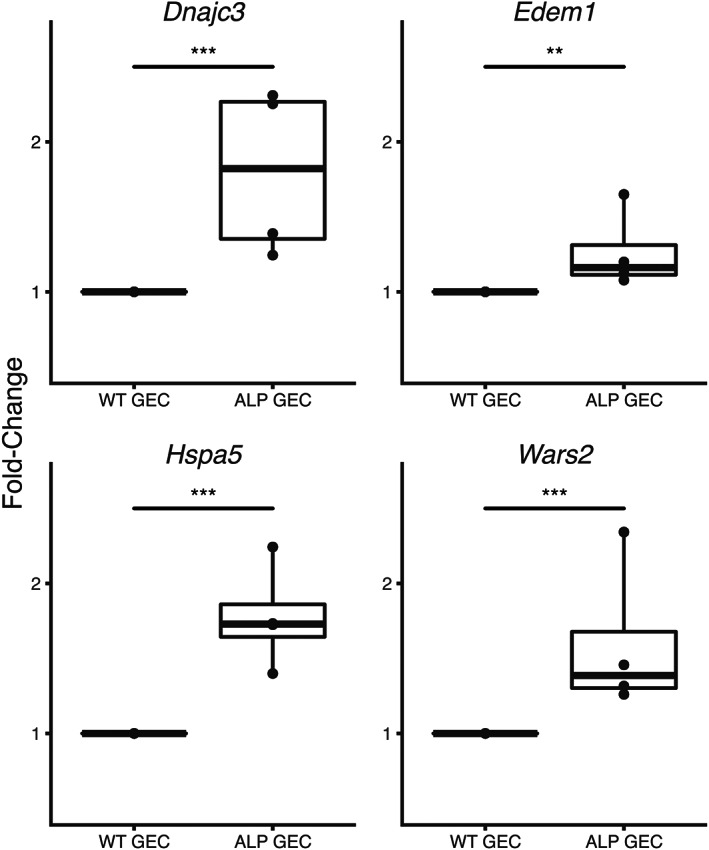
Genes associated with ER stress are induced in Alport podocytes relative to wild‐type podocytes. Cultured podocytes were differentiated for 14 days and the RNA was isolated and analyzed for the indicated transcripts by RT‐qPCR. The experiment was run in triplicate. **p < 0.01, ***p < 0.001.
There were about 150 transcripts significantly increased in relative abundance (based on Student's t‐tests) and about 150 that were significantly reduced in relative abundance in collagen α1(III)‐treated cells versus untreated cells. The complete list is provided in supplementary material, Table S1. We validated whether these transcripts are induced or suppressed in vivo using RNA‐seq data from glomerular RNA derived from 5‐ and 7‐week‐old 129 Sv autosomal Alport mice. Literature searches were performed for each gene to identify those previously implicated in glomerular disease or CKD. The genes that met these two criteria are listed in Table 1. Of the 18 genes identified that are induced or suppressed by collagen α1(III), only CTGF and ITGA2 have been previously implicated in Alport syndrome [13]. Thus, the remaining genes in Table 1 will be of interest for further studies. The data indicate not only genes that are implicated in podocyte injury but also some that have been shown to be protective, which may reflect a compensatory mechanism.
For most (12) of these genes, knockdown of either DDR1 or laminin α2 restored expression towards baseline levels, indicating that collagen α1(III) is inducing co‐receptor signaling via the two collagen receptors to regulate most of the genes. For three genes (Table 1), expression was restored towards baseline levels in DDR1‐knockdown cells but was unaffected in integrin α2‐knockdown cells, and for three genes (Table 1), expression was restored towards baseline levels in integrin α2‐knockdown cells but was unaffected in DDR1‐knockdown cells. These data clearly demonstrate that the two collagen receptors can either signal independently or jointly, with co‐receptor signaling being the dominant mechanism in podocytes.
Regarding the genes that are regulated by both DDR1 and α2β1 integrin, crosstalk between these two collagen receptors has been previously described. It is established that DDR1 activation can promote adhesion of α2β1 integrin to collagen [47], and to prevent α2β1‐dependent cell spreading on collagen via inhibition of CDC42 activity [48].
Discussion
The mesangial matrix protein collagen α1(III) progressively accumulates in the GBM of Alport mice and causes podocyte injury via aberrant cell signaling through either DDR1 or α2β1 integrin (rarely) or through DDR1/α2β1 co‐receptor signaling (mostly). Our transcriptome analysis approach identified many genes that are involved in the podocyte injury mechanism through their collagen α1(III)‐mediated dysregulation. This phenomenon likely accounts for why deletion of either DDR1 or integrin α2 ameliorates the renal phenotype in Alport mice [12, 13].
Super‐resolution microscopy studies suggested that the type IV collagen α3/α4/α5 network is too distant from the podocyte pedicles to interact with collagen receptors [6]. There is no direct evidence that this in fact occurs or that the collagen IV network activates collagen receptors on podocytes. The results in Figure 4B showed that DDR1 is not activated in podocytes of wild‐type glomeruli but is activated in podocytes of Alport glomeruli. Figure 4A showed that collagen α1(III) directly activates DDR1 in cultured podocytes. We have previously shown that Alport mice on the integrin α1‐null background show markedly delayed deposition of laminin α2 in the GBM [9]. In 5‐week‐old integrin α1‐null Alport mice, GBM deposition of collagen α1(III) is not yet apparent. Since these are Alport mice, the collagen network is entirely composed of type IV collagen α1/α2 protomers (supplementary material, Figure S5). DDR1 activation is not observed, demonstrating that the collagen α1/α2 network is not activating DDR1 receptors (Figure 5). Thus, collagen α1(III) in the GBM results in DDR1‐mediated podocyte injury. The fact that many of the same podocyte injury genes are activated in both collagen α1(III)‐treated podocytes and Alport glomeruli as a function of collagen α1(III) deposition in the GBM (Table 1) supports this notion.
One interesting and unexpected aspect of the data was that for 12 of these up‐ or down‐regulated genes validated in vivo and implicated in renal disease that are regulated by collagen α1(III), knockdown of either DDR1 or integrin α2 restored expression towards baseline levels. This clearly indicates that collagen α1(III) is inducing co‐receptor signaling in podocytes via the two collagen receptors to regulate most of the genes. For three genes, expression was restored towards baseline levels in DDR1‐knockdown cells but was unaffected in integrin α2‐knockdown cells. For three genes, expression was restored towards baseline levels in integrin α2‐knockdown cells but was unaffected in DDR1‐knockdown cells. None of the genes examined were unaffected in the knockdown studies, suggesting that we have identified all the collagen receptors involved. Remarkably, these data clearly demonstrate that the two collagen receptors can signal either independently or jointly.
It should be noted that early work in humans showed the presence of type V and type VI collagen in the GBM of Alport glomeruli [49]. The collagen antibodies in this study appeared to be properly validated by the manufacturer. Given concern that our results might reflect activation by either collagen V or collagen VI, we performed immunostaining of wild‐type and Alport glomeruli in 7‐week‐old mice using antibodies specific for these two collagens. Anti‐collagen V staining was not observed in either the mesangium or the GBM (supplementary material, Figure S6). Recently, however, punctate deposition of collagen VI in Alport GBM was reported in the 129 Sv ARAS Alport mouse GBM [50]. Thus, our in vivo results might reflect activation of DDR1 by collagen α1(III) and collagen VI. Collagen I has been shown to accumulate in the mesangium upon glomerular injury and to contribute to the pathobiology in diabetic nephropathy [51]. We did not see any significant difference in immunostaining for collagen I when comparing wild‐type and Alport glomeruli (supplementary material, Figure S7).
Our approach of exploring the role of collagen α1(III) in modulating gene expression first in vitro using conditionally immortalized podocytes from Alport mice and then validating that these genes are similarly and progressively modulated in vivo [given that collagen α1(III) progressively accumulated in the GBM] provides confidence that these genes likely underlie podocyte injury in Alport syndrome. One way to definitively test this would be to evaluate whether the genes return to baseline levels in glomeruli from integrin α2‐null Alport mice and/or DDR1‐null Alport mice. This approach would also allow one to explore whether co‐receptor signaling and DDR1‐specific or α2β1 integrin‐specific signaling are happening in vivo. It would then be possible to go back to the cell line approach to map the signaling cascades involved in mono‐ and co‐receptor signaling using small molecule inhibitors and/or siRNA knockdown approaches.
As shown in Table 1, many of the genes identified to be regulated by collagen α1(III) in vitro and in vivo have been previously associated with renal disease. Only CTGF (encoded by CCN2) and ITGA2 have been previously associated with Alport renal disease progression [13, 28]. Thus, this work reveals new and unexplored pathways that likely contribute to podocyte injury in Alport syndrome. In future work, these genes should have priority over ones that have not yet been associated with the pathobiology of the glomerulus.
Author contributions statement
JM performed bioinformatics analysis, data analysis, microscopy, and immunohistochemistry, and edited the manuscript. KW and DM performed cell culture work, immunohistochemistry, and western blotting. DD and GS maintained mouse colonies for analysis. DC conceived the project and wrote the manuscript.
Supporting information
Figure S1. Immunofluorescence for collagen α1(III) in glomeruli from wild‐type and Alport mice for semi‐quantification
Figure S2. Collagen α1(III) is expressed in the glomerular basement membrane of Alport mice
Figure S3. Alport dog glomeruli also have collagen α1(III) in the GBM
Figure S4. siRNA knockdown of integrin α2 (Itga2) or DDR1 (Ddr1) mRNAs treated with collagen α1(III) (C3a1)
Figure S5. Collagen α1(IV) is restricted to the mesangium of glomeruli from wild‐type mice and localizes to both the mesangium and the GBM of glomeruli from Alport mice
Figure S6. Collagen V is not expressed in the GBM of either wild‐type or Alport mice
Figure S7. Collagen I is weakly expressed in the mesangium of both wild‐type and Alport glomeruli and there is no difference in staining intensity when comparing the two
Table S1. Genes up‐regulated by collagen α1(III) in podocytes
Table S2. GSEA pathway analysis results from collagen α1(III)‐treated cells versus non‐treated, and 7‐week Alport versus WT glomerular data
Table S3. Gene Ontology Consortium pathways enriched in collagen α1(III)‐treated cells, synonymous with the top 100 pathways found in either the 5‐week Alport versus wild‐type, or the 7‐week Alport versus wild‐type glomerular RNA‐seq data processed using GSEA
Acknowledgements
This research was partially conducted at the Integrated Biomedical Imaging Facility at Creighton University, Omaha, NE. This facility is supported by the Creighton University School of Medicine and grants GM103427 and GM139762 from the National Institute of General Medical Science (NIGMS), a component of the National Institutes of Health (NIH). The facility was constructed with support from grants from the National Center for Research Resources (RR016469) and the NIGMS (GM103427). This work was supported by a grant from the NIH (NIH R01 DC015385) to DC and by a gift from Excubio Pharmaceuticals to DC. This investigation is solely the responsibility of the authors and does not necessarily represent the official views of the NIGMS or the NIH.
No conflicts of interest were declared.
Data availability statement
The complete data set for RNA‐seq results for both cell cultures and glomeruli are provided in the NCBI database (https://www.ncbi.nlm.nih.gov/bioproject/PRJNA690102).
References
- 1. Mochizuki T, Lemmink HH, Mariyama M, et al. Identification of mutations in the α3(IV) and α4(IV) collagen genes in autosomal recessive Alport syndrome. Nat Genet 1994; 8: 77–82. [DOI] [PubMed] [Google Scholar]
- 2. Lemmink HH, Mochizuki T, van den Heuvel LP, et al. Mutations in the type IV collagen alpha 3 (COL4A3) gene in autosomal recessive Alport syndrome. Hum Mol Genet 1994; 3: 1269–1273. [DOI] [PubMed] [Google Scholar]
- 3. Barker DF, Hostikka SL, Zhou J, et al. Identification of mutations in the COL4A5 collagen gene in Alport syndrome. Science 1990; 248: 1224–1227. [DOI] [PubMed] [Google Scholar]
- 4. Gunwar S, Ballester F, Noelken ME, et al. Glomerular basement membrane. Identification of a novel disulfide‐cross‐linked network of α3, α4, and α5 chains of type IV collagen and its implications for the pathogenesis of Alport syndrome. J Biol Chem 1998; 273: 8767–8775. [DOI] [PubMed] [Google Scholar]
- 5. Meehan DT, Delimont D, Cheung L, et al. Biomechanical strain causes maladaptive gene regulation, contributing to Alport glomerular disease. Kidney Int 2009; 76: 968–976. [DOI] [PMC free article] [PubMed] [Google Scholar]
- 6. Suleiman H, Zhang L, Roth R, et al. Nanoscale protein architecture of the kidney glomerular basement membrane. Elife 2013; 2: e01149. [DOI] [PMC free article] [PubMed] [Google Scholar]
- 7. Zallocchi M, Johnson BM, Meehan DT, et al. α1β1 integrin/Rac1‐dependent mesangial invasion of glomerular capillaries in Alport syndrome. Am J Pathol 2013; 183: 1269–1280. [DOI] [PMC free article] [PubMed] [Google Scholar]
- 8. Dufek B, Meehan D, Delimont D, et al. Endothelin A receptor activation on mesangial cells initiates Alport glomerular disease. Kidney Int 2016; 90: 300–310. [DOI] [PMC free article] [PubMed] [Google Scholar]
- 9. Cosgrove D, Rodgers K, Meehan D, et al. Integrin α1β1 and transforming growth factor‐β1 play distinct roles in Alport glomerular pathogenesis and serve as dual targets for metabolic therapy. Am J Pathol 2000; 157: 1649–1659. [DOI] [PMC free article] [PubMed] [Google Scholar]
- 10. Kashtan CE, Kim Y, Lees GE, et al. Abnormal glomerular basement membrane laminins in murine, canine, and human Alport syndrome: aberrant laminin α2 deposition is species independent. J Am Soc Nephrol 2001; 12: 252–260. [DOI] [PubMed] [Google Scholar]
- 11. Delimont D, Dufek BM, Meehan DT, et al. Laminin α2‐mediated focal adhesion kinase activation triggers Alport glomerular pathogenesis. PLoS One 2014; 9: e99083. [DOI] [PMC free article] [PubMed] [Google Scholar]
- 12. Gross O, Girgert R, Beirowski B, et al. Loss of collagen‐receptor DDR1 delays renal fibrosis in hereditary type IV collagen disease. Matrix Biol 2010; 29: 346–356. [DOI] [PubMed] [Google Scholar]
- 13. Rubel D, Frese J, Martin M, et al. Collagen receptors integrin alpha2beta1 and discoidin domain receptor 1 regulate maturation of the glomerular basement membrane and loss of integrin alpha2beta1 delays kidney fibrosis in COL4A3 knockout mice. Matrix Biol 2014; 34: 13–21. [DOI] [PubMed] [Google Scholar]
- 14. Cosgrove D, Meehan DT, Grunkemeyer JA, et al. Collagen COL4A3 knockout: a mouse model for autosomal Alport syndrome. Genes Dev 1996; 10: 2981–2992. [DOI] [PubMed] [Google Scholar]
- 15. Clark SD, Nabity MB, Cianciolo RE, et al. X‐linked Alport dogs demonstrate mesangial filopodial invasion of the capillary tuft as an early event in glomerular damage. PLoS One 2016; 11: e0168343. [DOI] [PMC free article] [PubMed] [Google Scholar]
- 16. Rao VH, Meehan DT, Delimont D, et al. Role for macrophage metalloelastase in glomerular basement membrane damage associated with Alport syndrome. Am J Pathol 2006; 169: 32–46. [DOI] [PMC free article] [PubMed] [Google Scholar]
- 17. Juskaite V, Corcoran DS, Leitinger B. Collagen induces activation of DDR1 through lateral dimer association and phosphorylation between dimers. Elife 2017; 6: e25716. [DOI] [PMC free article] [PubMed] [Google Scholar]
- 18. Lennon R, Byron A, Humphries JD, et al. Global analysis reveals the complexity of the human glomerular extracellular matrix. J Am Soc Nephrol 2014; 25: 939–951. [DOI] [PMC free article] [PubMed] [Google Scholar]
- 19. Randles MJ, Woolf AS, Huang JL, et al. Genetic background is a key determinant of glomerular extracellular matrix composition and organization. J Am Soc Nephrol 2015; 26: 3021–3034. [DOI] [PMC free article] [PubMed] [Google Scholar]
- 20. Bolger AM, Lohse M, Usadel B. Trimmomatic: a flexible trimmer for Illumina sequence data. Bioinformatics 2014; 30: 2114–2120. [DOI] [PMC free article] [PubMed] [Google Scholar]
- 21. Dobin A, Davis CA, Schlesinger F, et al. STAR: ultrafast universal RNA‐seq aligner. Bioinformatics 2013; 29: 15–21. [DOI] [PMC free article] [PubMed] [Google Scholar]
- 22. Liao Y, Smyth GK, Shi W. The R package Rsubread is easier, faster, cheaper and better for alignment and quantification of RNA sequencing reads. Nucleic Acids Res 2019; 47: e47. [DOI] [PMC free article] [PubMed] [Google Scholar]
- 23. Panina Y, Germond A, Masui S, et al. Validation of common housekeeping genes as reference for qPCR gene expression analysis during iPS reprogramming process. Sci Rep 2018; 8: 8716. [DOI] [PMC free article] [PubMed] [Google Scholar]
- 24. Subramanian A, Tamayo P, Mootha VK, et al. Gene set enrichment analysis: a knowledge‐based approach for interpreting genome‐wide expression profiles. Proc Natl Acad Sci U S A 2005; 102: 15545–15550. [DOI] [PMC free article] [PubMed] [Google Scholar]
- 25. Jia X, Yamamura T, Gbadegesin R, et al. Common risk variants in NPHS1 and TNFSF15 are associated with childhood steroid‐sensitive nephrotic syndrome. Kidney Int 2020; 98: 1308–1322. [DOI] [PMC free article] [PubMed] [Google Scholar]
- 26. Lelièvre E, Hinek A, Lupu F, et al. VE‐statin/egfl7 regulates vascular elastogenesis by interacting with lysyl oxidases. EMBO J 2008; 27: 1658–1670. [DOI] [PMC free article] [PubMed] [Google Scholar]
- 27. Wang D, Jin M, Zhao X, et al. FGF1ΔHBS ameliorates chronic kidney disease via PI3K/AKT mediated suppression of oxidative stress and inflammation. Cell Death Dis 2019; 10: 464. [DOI] [PMC free article] [PubMed] [Google Scholar]
- 28. Toda N, Mukoyama M, Yanagita M, et al. CTGF in kidney fibrosis and glomerulonephritis. Inflamm Regen 2018; 38: 14. [DOI] [PMC free article] [PubMed] [Google Scholar]
- 29. Lambert JP, Luongo TS, Tomar D, et al. MCUB regulates the molecular composition of the mitochondrial calcium uniporter channel to limit mitochondrial calcium overload during stress. Circulation 2019; 140: 1720–1733. [DOI] [PMC free article] [PubMed] [Google Scholar]
- 30. Yokoyama K, Tezuka T, Kotani M, et al. NYAP: a phosphoprotein family that links PI3K to WAVE1 signalling in neurons. EMBO J 2011; 30: 4739–4754. [DOI] [PMC free article] [PubMed] [Google Scholar]
- 31. Lin X, Huang H, You Y, et al. Activation of TLR5 induces podocyte apoptosis. Cell Biochem Funct 2016; 34: 63–68. [DOI] [PubMed] [Google Scholar]
- 32. Hayek SS, Koh KH, Grams ME, et al. A tripartite complex of suPAR, APOL1 risk variants and αvβ3 integrin on podocytes mediates chronic kidney disease. Nat Med 2017; 23: 945–953. [DOI] [PMC free article] [PubMed] [Google Scholar]
- 33. Fang J, Yao X, Hou M, et al. ApoL1 induces kidney inflammation through RIG‐I/NF‐κB activation. Biochem Biophys Res Commun 2020; 527: 466–473. [DOI] [PubMed] [Google Scholar]
- 34. Hahn WH, Suh JS, Cho BS. Linkage and association study of neurotrophins and their receptors as novel susceptibility genes for childhood IgA nephropathy. Pediatr Res 2011; 69: 299–305. [DOI] [PubMed] [Google Scholar]
- 35. Ohno S, Yokoi H, Mori K, et al. Ablation of the N‐type calcium channel ameliorates diabetic nephropathy with improved glycemic control and reduced blood pressure. Sci Rep 2016; 6: 27192. [DOI] [PMC free article] [PubMed] [Google Scholar]
- 36. Deng C, Chen H, Yang N, et al. Apela regulates fluid homeostasis by binding to the APJ receptor to activate Gi signaling. J Biol Chem 2015; 290: 18261–18268. [DOI] [PMC free article] [PubMed] [Google Scholar]
- 37. Sugano Y, Lindenmeyer MT, Auberger I, et al. The Rho‐GTPase binding protein IQGAP2 is required for the glomerular filtration barrier. Kidney Int 2015; 88: 1047–1056. [DOI] [PubMed] [Google Scholar]
- 38. Dou L, Poitevin S, Sallée M, et al. Aryl hydrocarbon receptor is activated in patients and mice with chronic kidney disease. Kidney Int 2018; 93: 986–999. [DOI] [PubMed] [Google Scholar]
- 39. Tao J, Lan Z, Wang Y, et al. Large‐conductance calcium‐activated potassium channels in glomerulus: from cell signal integration to disease. Front Physiol 2016; 7: 248. [DOI] [PMC free article] [PubMed] [Google Scholar]
- 40. Boini KM, Xia M, Abais JM, et al. Activation of inflammasomes in podocyte injury of mice on the high fat diet: effects of ASC gene deletion and silencing. Biochim Biophys Acta 2014; 1843: 836–845. [DOI] [PMC free article] [PubMed] [Google Scholar]
- 41. Chuang CT, Guh JY, Lu CY, et al. Steap4 attenuates high glucose and S100B‐induced effects in mesangial cells. J Cell Mol Med 2015; 19: 1234–1244. [DOI] [PMC free article] [PubMed] [Google Scholar]
- 42. Kerroch M, Guerrot D, Vandermeersch S, et al. Genetic inhibition of discoidin domain receptor 1 protects mice against crescentic glomerulonephritis. FASEB J 2012; 26: 4079–4091. [DOI] [PubMed] [Google Scholar]
- 43. Chiusa M, Hu W, Liao HJ, et al. The extracellular matrix receptor discoidin domain receptor 1 regulates collagen transcription by translocating to the nucleus. J Am Soc Nephrol 2019; 30: 1605–1624. [DOI] [PMC free article] [PubMed] [Google Scholar]
- 44. Fan Q, Zhang H, Ding J, et al. R168H and V165X mutant podocin might induce different degrees of podocyte injury via different molecular mechanisms. Genes Cells 2009; 14: 1079–1090. [DOI] [PubMed] [Google Scholar]
- 45. Samali A, Fitzgerald U, Deegan S, et al. Methods for monitoring endoplasmic reticulum stress and the unfolded protein response. Int J Cell Biol 2010; 2010: 830307. [DOI] [PMC free article] [PubMed] [Google Scholar]
- 46. Pieri M, Stefanou C, Zaravinos A, et al. Evidence for activation of the unfolded protein response in collagen IV nephropathies. J Am Soc Nephrol 2014; 25: 260–275. [DOI] [PMC free article] [PubMed] [Google Scholar]
- 47. Xu H, Bihan D, Chang F, et al. Discoidin domain receptors promote α1β1‐ and α2β1‐integrin mediated cell adhesion to collagen by enhancing integrin activation. PLoS One 2012; 7: e52209. [DOI] [PMC free article] [PubMed] [Google Scholar]
- 48. Yeh YC, Wang CZ, Tang MJ. Discoidin domain receptor 1 activation suppresses α2β1 integrin‐dependent cell spreading through inhibition of Cdc42 activity. J Cell Physiol 2009; 218: 146–156. [DOI] [PubMed] [Google Scholar]
- 49. Kashtan CE, Kim Y. Distribution of the α1 and α2 chains of collagen IV and of collagens V and VI in Alport syndrome. Kidney Int 1992; 42: 115–126. [DOI] [PubMed] [Google Scholar]
- 50. Randles M, Lausecker F, Kong Q, et al. Identification of an altered matrix signature in kidney aging and disease. J Am Soc Nephrol 2021; 32: 1713–1732. [DOI] [PMC free article] [PubMed] [Google Scholar]
- 51. Hornigold N, Johnson TS, Huang L, et al. Inhibition of collagen I accumulation reduces glomerulosclerosis by a Hic‐5‐dependent mechanism in experimental diabetic nephropathy. Lab Invest 2013; 93: 553–565. [DOI] [PubMed] [Google Scholar]
Associated Data
This section collects any data citations, data availability statements, or supplementary materials included in this article.
Supplementary Materials
Figure S1. Immunofluorescence for collagen α1(III) in glomeruli from wild‐type and Alport mice for semi‐quantification
Figure S2. Collagen α1(III) is expressed in the glomerular basement membrane of Alport mice
Figure S3. Alport dog glomeruli also have collagen α1(III) in the GBM
Figure S4. siRNA knockdown of integrin α2 (Itga2) or DDR1 (Ddr1) mRNAs treated with collagen α1(III) (C3a1)
Figure S5. Collagen α1(IV) is restricted to the mesangium of glomeruli from wild‐type mice and localizes to both the mesangium and the GBM of glomeruli from Alport mice
Figure S6. Collagen V is not expressed in the GBM of either wild‐type or Alport mice
Figure S7. Collagen I is weakly expressed in the mesangium of both wild‐type and Alport glomeruli and there is no difference in staining intensity when comparing the two
Table S1. Genes up‐regulated by collagen α1(III) in podocytes
Table S2. GSEA pathway analysis results from collagen α1(III)‐treated cells versus non‐treated, and 7‐week Alport versus WT glomerular data
Table S3. Gene Ontology Consortium pathways enriched in collagen α1(III)‐treated cells, synonymous with the top 100 pathways found in either the 5‐week Alport versus wild‐type, or the 7‐week Alport versus wild‐type glomerular RNA‐seq data processed using GSEA
Data Availability Statement
The complete data set for RNA‐seq results for both cell cultures and glomeruli are provided in the NCBI database (https://www.ncbi.nlm.nih.gov/bioproject/PRJNA690102).