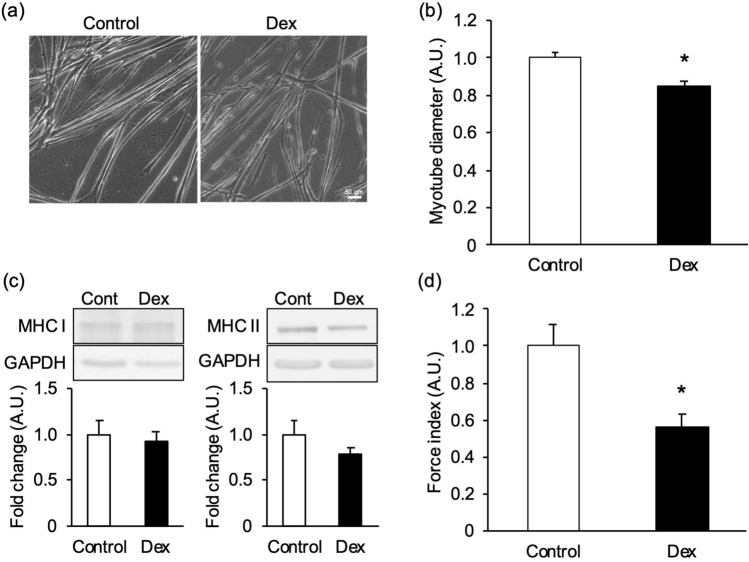
Figure 5.
Evaluation of muscle mass and contractile force in myotubes treated with dexamethasone. Dexamethasone (Dex)- induced atrophic myotubes were evaluated by their diameter, myosin heavy chain (MHC) expression levels, and “force index,” an index of contractile force. Myotubes were treated with 100 mM dexamethasone in the differentiation medium on the 5th day of differentiation and cultured for 48 h. Control cells were treated with 0.1% (v/v) DMSO (Control). (a) Control- and dexamethasone- treated myotubes cultured on the substrate. Scale bar is 50 µm. (b) Diameter of dexamethasone- treated myotubes. The myotube diameter treated with dexamethasone was lower than that of the control. N = 10 (N represents an independent experiment; each “N” shows the average value from all myotubes of five random fields on the same substrate). (c) Representative blots of MHC I, MHC II, and glyceraldehyde-3-phosphate dehydrogenase (GAPDH), and quantification of the proteins on western blots. No significant changes in MHC I or II were observed between Control and dexamethasone. Blots are cropped original images of MHC I, MHC II, and GAPDH. Original images are presented in Supplementary Fig. 3. N = 10. (d) Force index as an index of contractile force. The myotubes were stimulated by an electrical pulse (20 mA, 20 ms duration, 980 ms intervals, 1 Hz). The force index for dexamethasone- treated myotubes was significantly lower than that of the control. N = 10 (N represents an independent experiment; each “N” shows the average value from 12 areas on the same substrate). Data are shown as mean ± S.E.M., *P < 0.05, vs. control (Student’s t-test).

