Fig. 1.
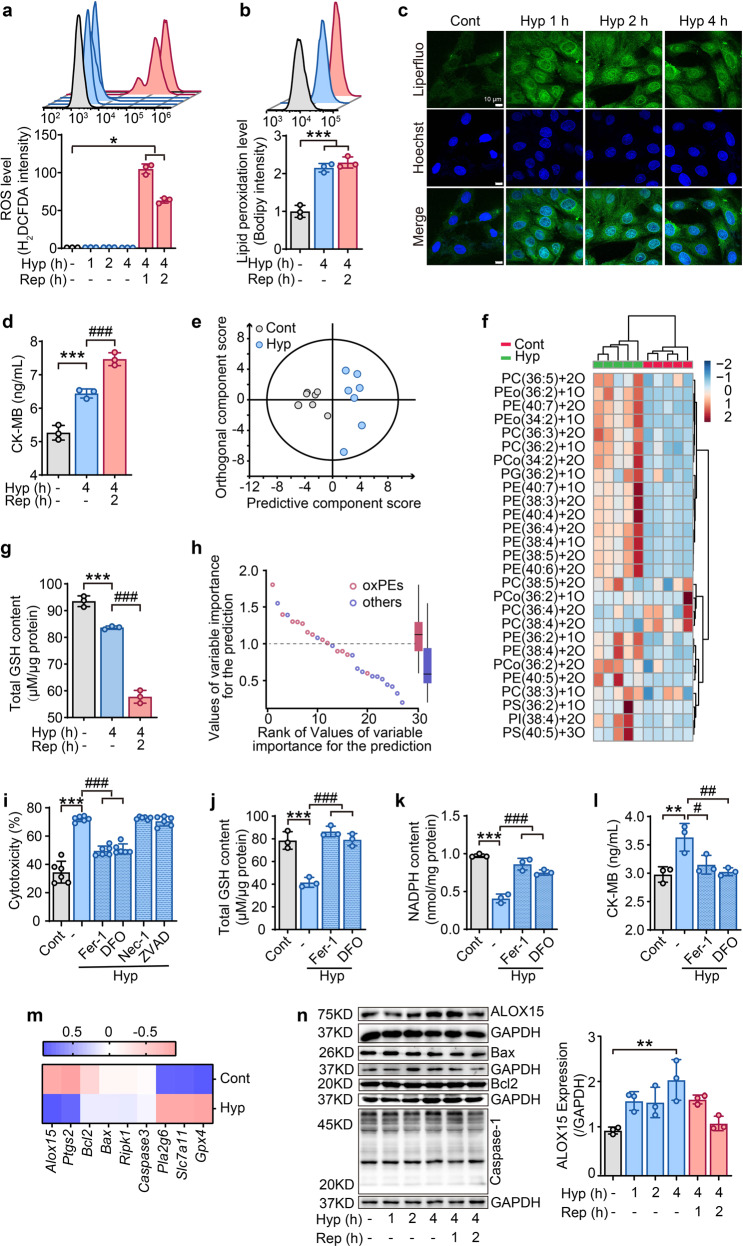
Phospholipid peroxidation is triggered by hypoxia in cardiomyocytes. a After hypoxia/reoxygenation, ROS levels in H9C2 cells were measured by H2DCFDA staining using flow cytometry at different time points. b Lipid ROS detected by flow cytometry after staining H9C2 cells with Bodipy. c Lipid ROS detected by confocal microscopy performed at different time periods of hypoxia in H9C2 cells stained with Liperfluo. d CK-MB content in H9C2 cells after hypoxia/reoxygenation. e Multivariate statistical analysis of oxidative phospholipids using OPLS-DA analysis between control and hypoxia-treated cells. Each point represents a sample (n = 7). f Heat map indicating changes to different oxPLs in hypoxia-exposed H9C2 cells (n = 5). g GSH content in H9C2 cells treated with hypoxia/reoxygenation. h Dot plots demonstrating variable importance for prediction scores of various oxPLs species in distinguishing control versus ischemia-treated H9C2 cells. PE-ox species (variable importance for prediction score>1) were the predominant oxidized species that separated the control from hypoxia treatment (n = 7). i Effect of different cell death inhibitors on the cytotoxicity of H9C2 cells exposed to 4-h hypoxia. All inhibitors were pretreated for 2 h before hypoxia treatment. Ferroptosis inhibitor: ferrostatin-1(Fer-1, 1 μM), deferoxamine (DFO, 100 μM); necroptosis inhibitor: necrostatin-1 (Nec-1, 1 μM); apoptosis inhibitor: Z-VAD-FMK (ZVAD, 1 μM). Effects of ferroptosis inhibitors on the contents of total GSH (j), NADPH (k), and CK-MB (l) after 4-h hypoxia. Ferrostatin-1 (Fer-1, 1 μM) and deferoxamine (DFO, 100 μM) were pretreated for 2 h before hypoxia treatment. m A summary heat map of quantitative RT-PCR analysis of genes related with ferroptosis (Alox15, Ptgs2, Pla2g6, Slc7a11, and Gpx4), apoptosis (Bcl2 and Bax), and necrosis (Ripk1) in H9C2 cells treated with 4-h hypoxia (n = 3). n Protein expressions for ALOX15, Bax, Bcl2 and Caspase-1 in hypoxia/reoxygenation treated H9C2 cells (n = 3). The right panel indicates the statistical analysis forALOX15 expression. All the quantitative data are presented as mean ± SD and statistical significance was assessed by one-way ANOVA followed by Tukey post-hoc test. *p < 0.05, **p < 0.01, ***p < 0.001 vs control (cont) group; #p < 0.05, ##p < 0.01, ###p < 0.001 vs hypoxia (Hyp) group

