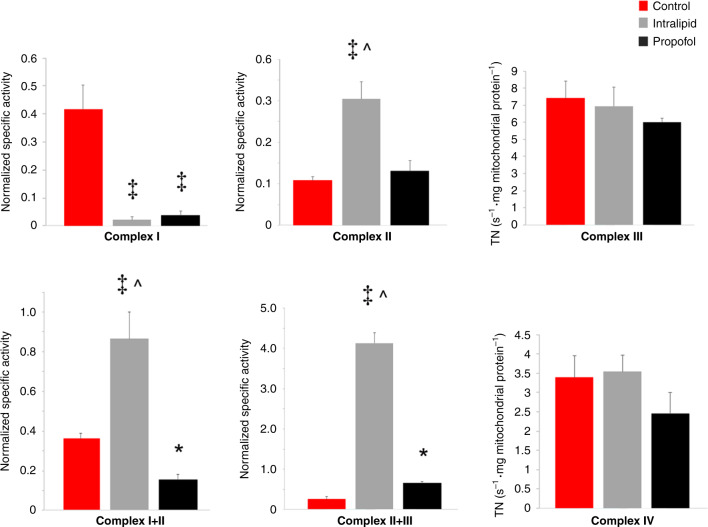
Fig. 5. Cardiomyocyte electron transport chain enzyme complex kinetic activity.
Steady-state kinetic activities were determined in non-exposed controls and in mitochondria exposed to propofol (400 µM) or intralipid. The specific activities normalized to citrate synthase activity are depicted (n = 4–5 per group). Coenzyme Q-dependent respiration was assessed by measuring linked Complex I+III and Complex II+III kinetic activities. First-order rate constants were determined for Complexes III and IV and expressed as turnover number (TN). Values are expressed as means ± SD. p values were calculated by one-way ANOVA. *p < 0.05 vs. control, ‡p < 0.001 vs. control, ^p < 0.001 vs. propofol-exposed group.

