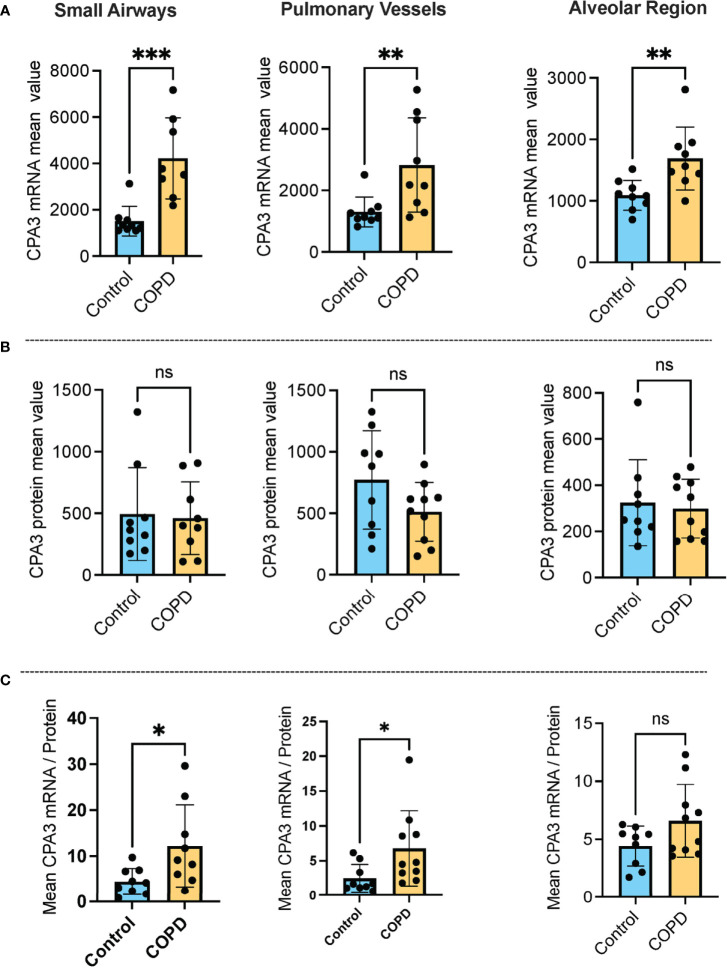
Figure 1.
Increased mast cell CPA3 mRNA expression across major lung compartments in COPD lungs. (A–C) Mean patient values for individual mast cell expression of CPA3 mRNA (A), CPA3 protein (B), and the mean mRNA/protein quotient (C) in control subjects and COPD category GOLD 4 patients. In total, >18,000 individual mast cells were analyzed in the control group and >41,000 mast cells were analyzed in the COPD group. Dots denote mean patient values of >1,500 individual mast cells per control tissue and >2,500 mast cells per COPD patient. Statistical significance levels are marked as ns = non-significant, *p < 0.05, **p < 0.01, and ***p < 0.001.

