Figure 2.
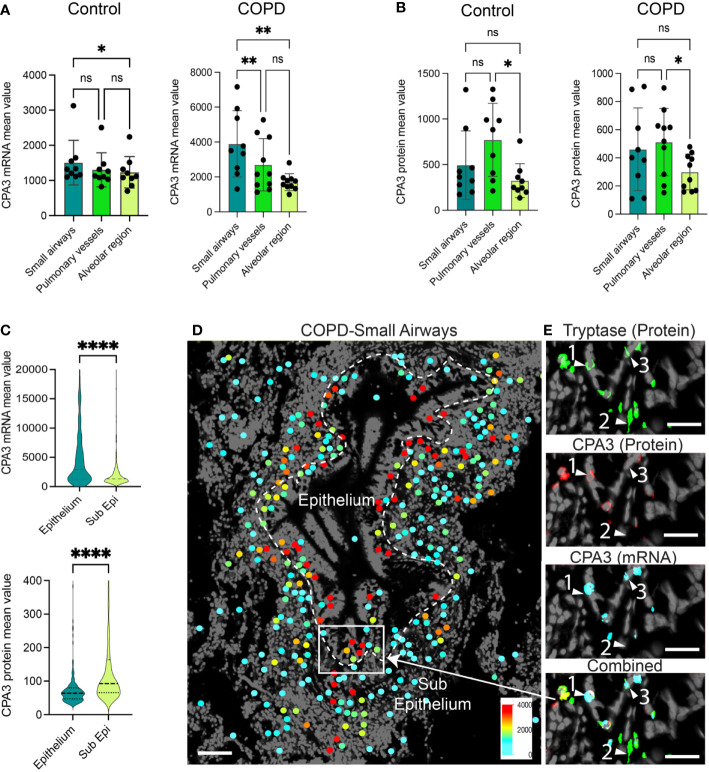
Anatomically differentiated mast cell CPA3 expression responses in COPD lungs. (A, B) Mean patient values for individual mast cell expression of CPA3 mRNA (A) and CPA3 protein (B) across anatomical lung compartments in non-diseased controls and COPD lungs. Statistical significance levels are marked as ns = non-significant, *p < 0.05, **p < 0.01, and ****p < 0.0001. (C) Raincloud plots illustrating the difference in CPA3 mRNA and protein expression profiles between small airway intraepithelial and sub-epithelial small airway mast cells. (D) Zoomed-in region with a small airway where size-filtered mast cell coordinates have been color-coded for CPA3 level (high = red; low = turquoise). Note the foremost red CPA3high profile in the epithelial region. (E) Raw fluorescence images of MC markers exemplifying a CPA3 mRNA+protein double-positive mast cell (label 1), CPA3 mRNA and protein double-negative cell (2), and a CPA3 mRNA-positive and protein-negative cell (3) at an epithelial–subepithelial interface. Scale bars: D = 150 μm, E = 40 μm.

