Figure 3.
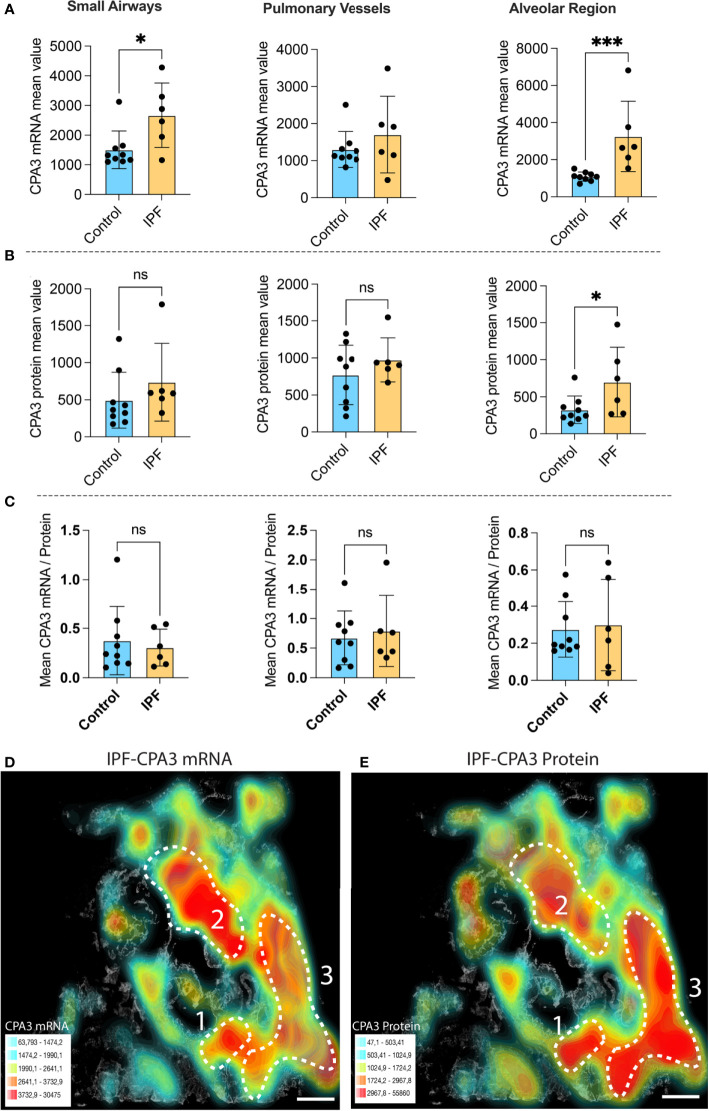
The expanded mast cell population in distal IPF lungs has a robust upregulation of both CPA3 mRNA and protein. (A–C) Mean patient values for individual mast cell expression of CPA3 mRNA (A), CPA3 protein (B), and the mean mRNA/protein quotient (C) across control subjects and COPD patients. A total of >81,000 individual mast cells were analyzed in the IPF disease group, and each dot denotes mean patient values of >12,000 mast cells per IPF patient. Statistical significance levels are indicated as ns = non-significant, *p < 0.05, and ***p < 0.001. (D, E) Low-power micrograph of a representative IPF lung section where a gray-scale background tissue is overlayed with color-coded density maps (high–low is shown as red–turquoise) displaying combined mast cell density and expression levels of CPA3 mRNA (D) or CPA3 protein (E). Note that although both the level of protein and mRNA is high, the relative proportion varies across tissue microenvironments, as illustrated by a CPA3 mRNAhigh, proteinmoderate profile in region 2 and a CPA3 mRNAmoderate, proteinhigh signature in region 3. Scale bars = 1.8 mm.

