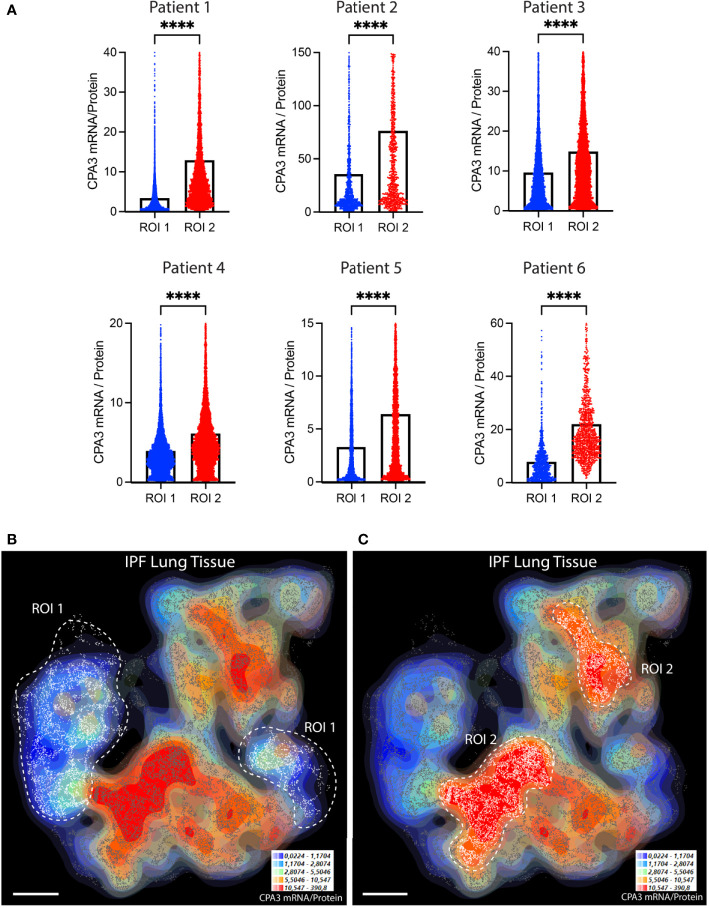
Figure 4.
The relative proportion of mast cell CPA3 mRNA and stored protein vary significantly between lung tissue microenvironments. (A) Quantitative data and violin plots comparing individual mast cell CPA3 mRNA/protein quotients in pre-determined spatial lung section regions of interest (ROIs). Regions with relatively low (ROI type 1) or high (ROIs 2) quotients were selected from computer-generated topographic contour maps visualizing the heterogeneous spatial distribution of mRNA/protein quotients (exemplified for one IPF section in (B) and (C); red denotes spatial regions with a high quotient; coordinates for individual mast cells are shown as white-gray dots). Scale bars: B, C = 3.5 mm. Black bars in A show mean values and statistical analysis was performed by a Mann–Whitney U test and where **** denotes a significance level of p < 0.0001.

