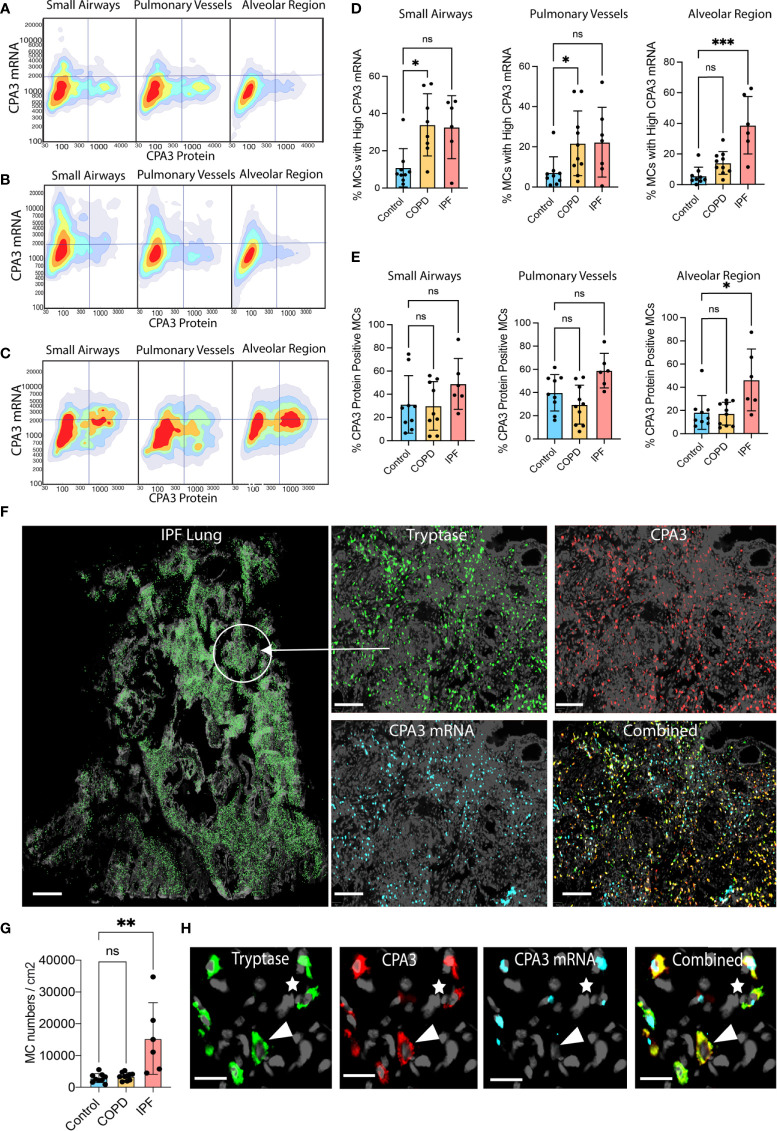
Figure 5.
Disease-specific small airway and alveolar CPA3 responses in COPD and IPF. (A–C) 2D scattergrams showing CPA3 mRNA and protein relationships across pooled mast cells from control lungs (A; n = 18,504 pooled MCs), COPD (B; n = 41,313), and IPF cases (C; n = 81 806). (D, E) Mean patient percentage of lung mast cells with a high CPA3-mRNA profile (D) or CPA3 protein (E) within anatomical regions and disease categories (as defined by a pre-determined locked threshold values). (F) Low-power graph exemplifying the very high density of mast cells in distal IPF lung. To visualize individual mast cells, their x,y coordinates have been replaced with pseudo-colored green circles (left). The right quartet set of images shows the original fluorescence-based staining in a zoomed-in region. (G) Mean patient lung mast cell density levels. Statistical significance levels are marked as ns = non-significant, *p < 0.05, **p < 0.01, ***p < 0.001. (H) Zoomed-in ICH and IHC fluorescence images exemplifying a CPA3mRNA-, protein+ MC (arrowhead) and a CPA3mRNA+, protein+ MC (* uppermost right corner). Scale bars: H = 25 μm, F-left = 1.8 mm, F-right =200 μm.

