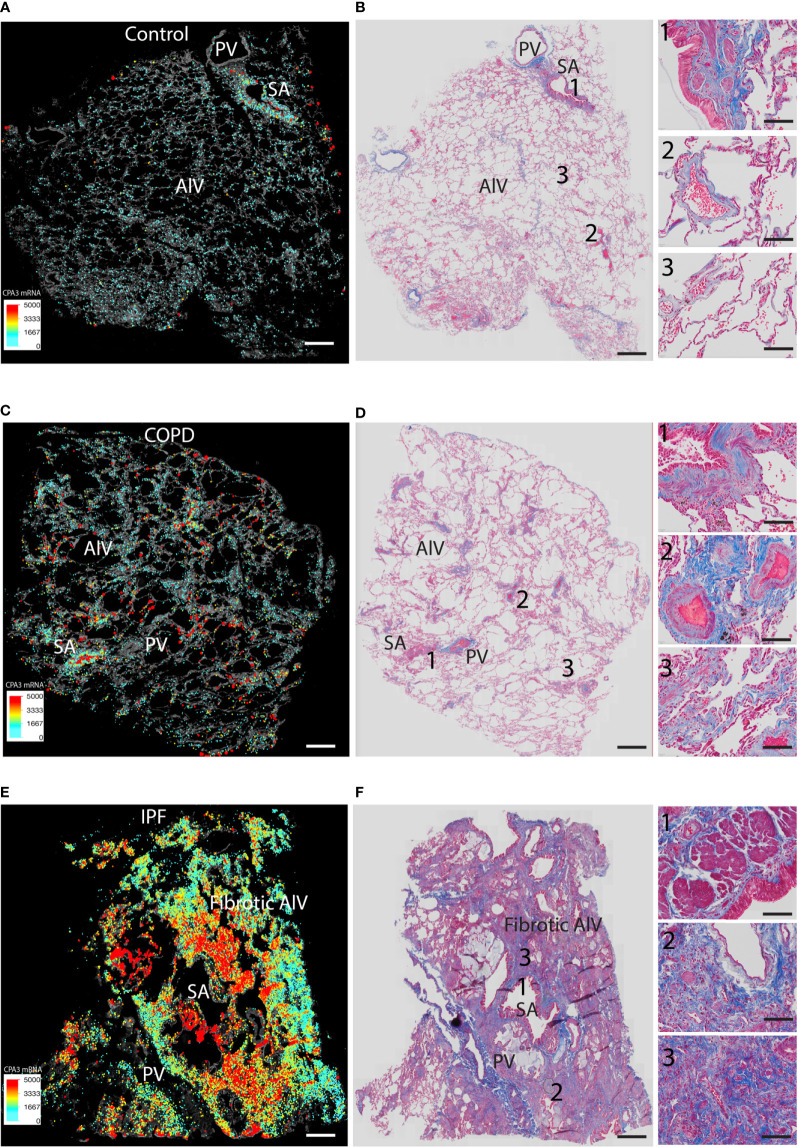
Figure 6.
Comparisons of density-weighted and spatial CPA3 variations and lung structure in non-diseased control tissue, COPD lungs, and IPF. (A, C, E) Low-power section overviews with gray-scale tissue background in control lung (A), COPD (C), and IPF (D) where x,y coordinates for individual mast cells have been replaced with enlarged dots color and size coded for CPA3mRNA expression levels. (B, D, E) Corresponding serial section stained with routine trichrome staining to visualize cells (red) and collagen-rich extracellular matrix (blue) and overall lung structure. SA = small airways; PV = pulmonary vessels; Alv = alveolar parenchyma. The COPD section in (C, D) show microscopic emphysema whereas the IPF in E and F displays archetype histopathological IPF features like honeycombing, myofibroblast accumulation, and distal parenchymal fibrosis. Scale bars: A–F = 1.8 mm, insets in B, D, F = 200 μm.

