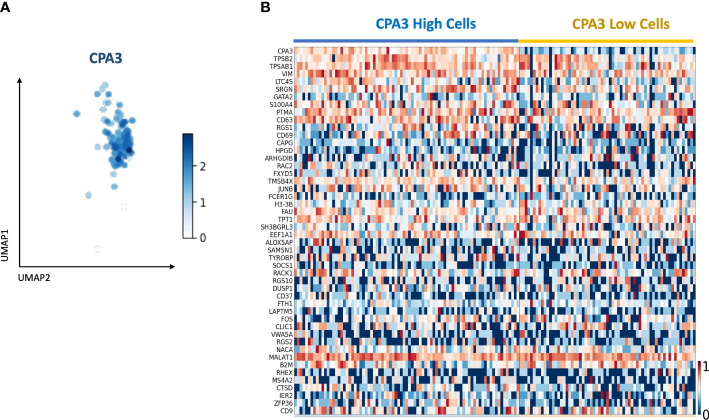
Figure 8.
Single-cell RNA sequencing identifies a mast cell population with CPA3 high and low gene expression. (A) UMAP of the subset of mast cells determined by the expression of commonly known last cell markers (TPSB2, TPSAB1, MS4A2, and CPA3). CPA3 expression is shown. (B) Gene expression heatmap showing cells with “high” and “low” CPA3. Cells were considered “high” when CPA3 expression was above 1.5 and “low” when CPA3 expression was below or equal to 1.5. The genes on the y-axis are the top 48 upregulated genes within the mast cell population.

