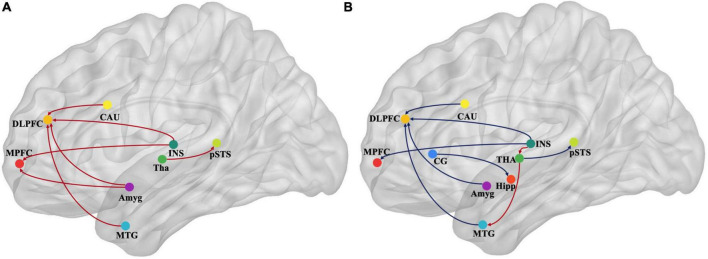
FIGURE 4.
Map illustrating brain of multivariate GCA signed-path coefficients alteration after treatment in the immersive-VR group (A) and the control group (B). Some brain regions only showed projection position. Blue/red arrows designate significantly weaken/strengthen of causal connectivity after treatment as compared to baseline levels. MPFC, medial prefrontal cortex; DLPFC, dorsolateral prefrontal cortex; MTG, middle temporal gyrus; pSTS, posterior superior temporal sulcus; INS, insular gyrus; CG, cingulate gyrus; Amyg, amygdala; Hipp, hippocampus; CAU, caudate, Tha, Thalamus. GCA, granger causality analysis.

