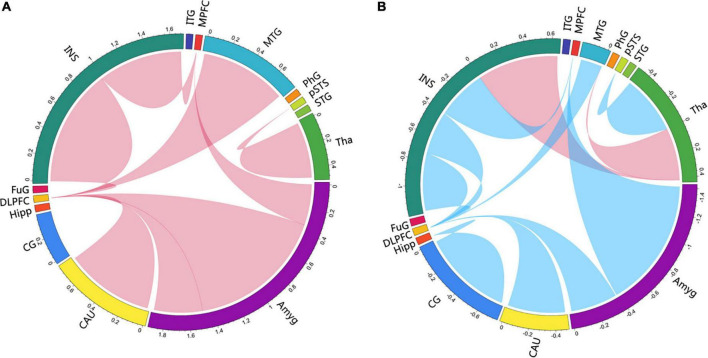
FIGURE 5.
Circlize maps of signed-path coefficient alteration after treatment in the immersive-VR group (A) and the control group (B) from multivariate granger causality analysis. The parameters represent the intensity of the signed-path coefficients differences after treatment as compared to baseline levels. Blue/red lines designate significantly weaken/strengthen of causal connectivity after treatment as compared to baseline levels. MPFC, medial prefrontal cortex; DLPFC, dorsolateral prefrontal cortex; MTG, middle temporal gyrus; pSTS, posterior superior temporal sulcus; INS, insular gyrus; CG, cingulate gyrus; Amyg, amygdala; Hipp, hippocampus; CAU, caudate, Tha, Thalamus.

