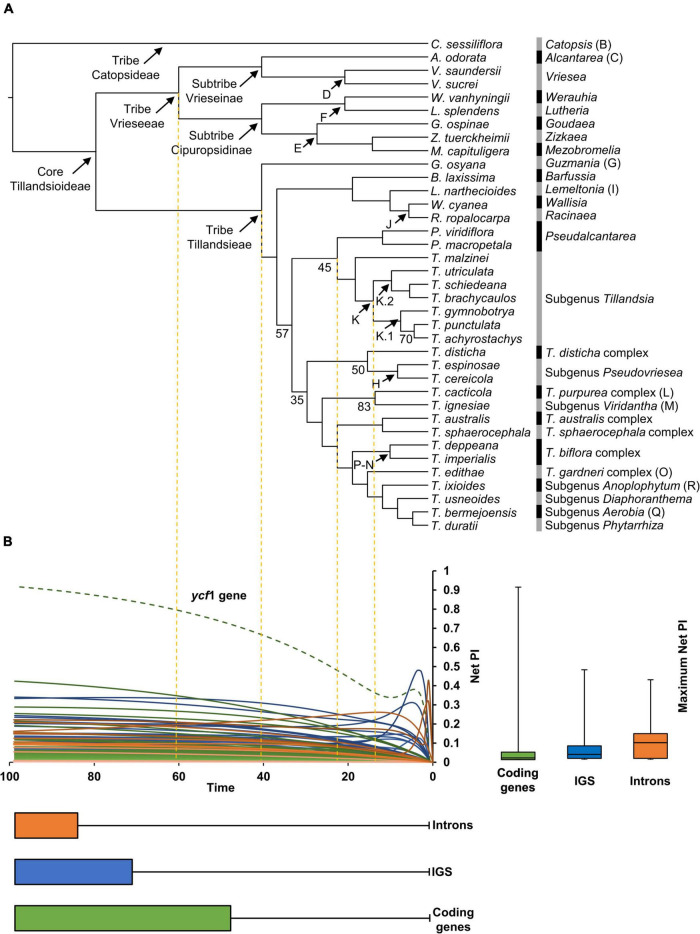
FIGURE 2.
(A) Phylogenetic relationships obtained from the IQ-TREE ML analysis with branch lengths converted to ultrametric. Clade names and letters identifying genera, subgenera and species complexes follow Barfuss et al. (2016) and Granados Mendoza et al. (2017). Support values are shown below the branches for nodes with BS <85%. (B) Net phylogenetic informativeness (PI) profiles of plastid coding genes (green), intergenic spacers (blue), and introns (orange). The green dashed curve corresponds to the ycf1 gene, which surpassed by far the PI of any other marker. Distribution of loci’s maximum net PI values and time at which these values were reached is shown with quantiles 2 and 3 to the right and below the PI profiles, respectively. Whiskers denote maximum and minimum values. The arbitrary time scale of the PI profiles matches the one of the ultrametric tree in (A).

